#SUI🔥 (SUI/USDT)
1. Market Structure Overview
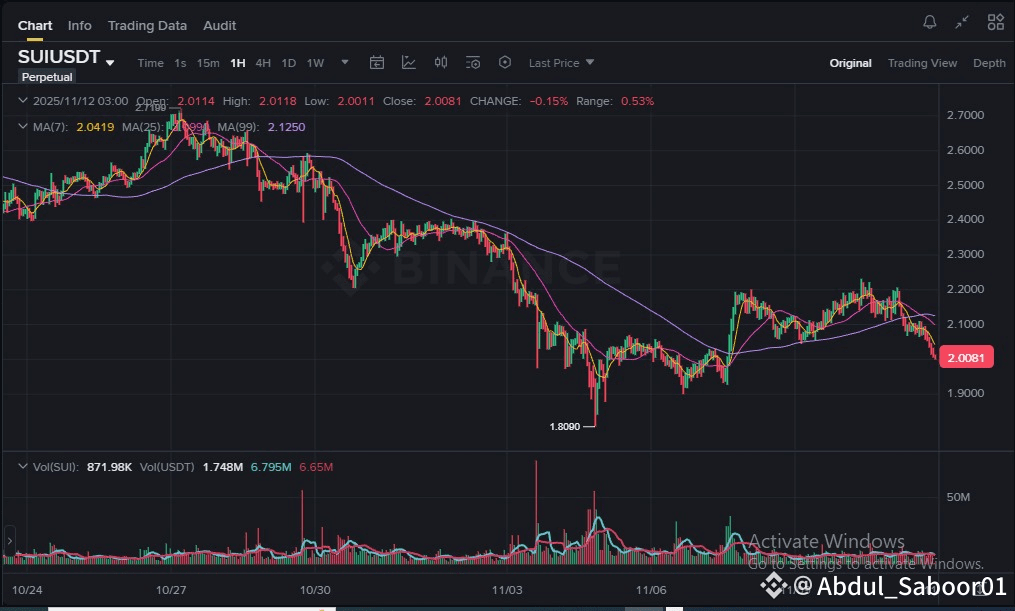
Timeframe: 1 Hour (H1)
Current Price: ~$2.008
Trend: Weakening bullish momentum → possible short-term correction
Structure:
Higher low formed around $1.89 → $1.95 → $2.00, showing some buying interest.
But lower highs near $2.25 → $2.18 → $2.10 indicate sellers still active.
Market seems to be in a consolidation phase after a mini uptrend — no clear breakout yet.
Reversal confirmation only if price closes above
$2.15–$2.20 zone.
Break below $1.95 will flip structure bearish again.
2. Moving Averages (MA7, MA25, MA99)
MA Type Value Interpretation
MA(7) $2.0419 Short-term trend turning slightly bearish
MA(25) $2.1150 Medium-term resistance
MA(99) $2.1250 Long-term resistance zone
Current Status:
MA(7) below MA(25) indicates short-term weakness.
Price trading below all MAs bearish pressure dominating.
For trend reversal, price must reclaim and close above MA(25) ($2.12+).
If price holds $2.00 support and crosses $2.12 again, it could trigger a bullish reversal.
3. RSI (Relative Strength Index)
Estimated RSI: ~46–50 range
Neutral zone neither overbought nor oversold.
Slight downward bias suggests mild selling pressure.
RSI below 45 signals possible dip to $1.95.
RSI rebound above 55 first bullish sign.
Momentum cooling off but not collapsing yet.
4. MACD (Moving Average Convergence Divergence)
MACD line below Signal line bearish crossover.
Histogram showing small red bars, indicating slowing momentum.
If histogram starts turning green, expect bounce from $2.00 support.
Current MACD setup favors short-term sellers.
5. Volume Analysis
Volume decreasing after last rally eans traders are waiting for confirmation.
Buying volume spikes around $1.90–$2.00 indicate strong accumulation zone.
If price drops below $1.95 with low volume ould bounce quickly.
Break above $2.15 with volume surge ullish confirmation.
Volume supports accumulation phase; whales likely loading below $2.
6. Key Levels
Type Price Zone Strength Notes
Resistance 1 $2.15–$2.20 Medium Must break for trend reversal
Resistance 2 $2.35 Strong Next rally target
Support 1 $2.00 Strong Psychological level
Support 2 $1.95 Critical If lost, bearish move likely
Support 3 $1.89 Major Last major low / bounce zone
7. Next Move Prediction
Bullish Scenario (55% Probability)
Price holds $2.00–$1.95 and reclaims $2.12+
RSI > 55, MACD green
Target Zones: $2.20 → $2.35 → $2.50
Confirmation: Candle close above $2.15
Bearish Scenario (45% Probability)
Fails to hold $2.00 drops to $1.89
If $1.89 breaks next support around $1.75
MACD stays red, RSI under 45
Trading Plan (Short-Term)
Action Entry Target Stop Loss Comment
Buy (Long) $2.00–$2.05 $2.20–$2.35 $1.94 Bounce setup
Add on Breakout Above $2.15 $2.35–$2.50 $2.08 Confirmation trade
Short (Only if breakdown) Below $1.94 $1.85 $2.00 Counter-trend, risky
Summary
Trend: Consolidation, mild bearish bias
Indicators: RSI neutral, MACD bearish but flattening
Volume: Supports accumulation zone near $2
Watch Level: $2.00 make or break zone
Reversal Signal: Break above $2.15 = next wave to $2.35+