Alright team, let's break down this juicy $BTC chart and see what's cooking. The daily chart presents one of the cleanest bullish continuation setups we've seen this month!
### Technical Analysis
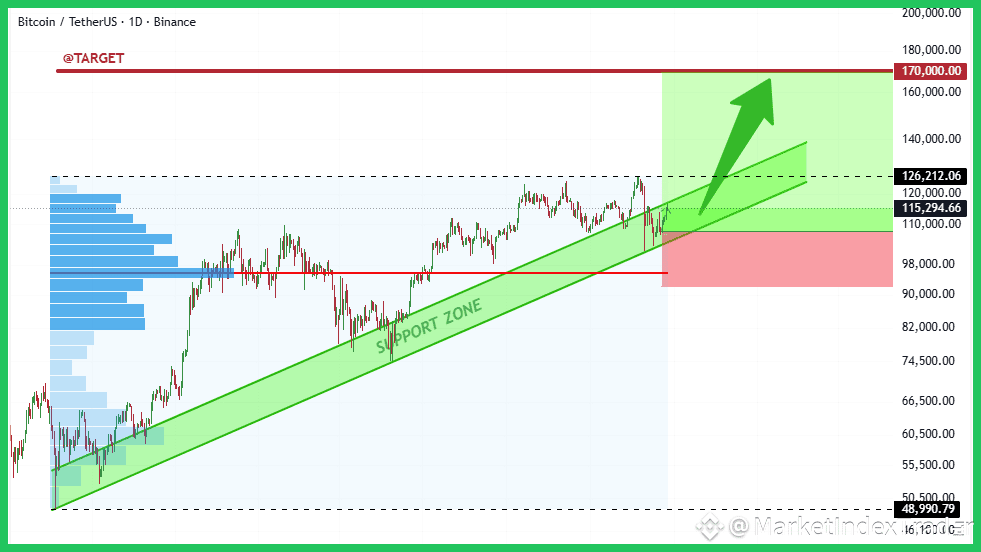
Bitcoin has successfully held the bottom of its key long-term Rising Support Zone (highlighted in green). This confirms strong buying interest below $115,000. We are currently consolidating, eyeing a break above immediate resistance at $126,212. A successful breakout here opens the path toward the massive projected target of $170,000. The invalidation point (Stop Loss) for this trade is marked clearly below $98,000.
### Fundamental Analysis
On the fundamental side, Bitcoin's structure is incredibly tight. We are witnessing sustained positive net inflows into US Spot ETFs, underscoring strong institutional demand that keeps supply pressure off the market. Post-Halving supply dynamics are expected to accelerate this scarcity narrative throughout the latter half of the year.
### Action Plan
Maintaining a long position here with a tight stop-loss is the prudent strategy. We must confirm a daily close above the $126K mark to feel highly confident about the $170K run. Buy the dip strategy remains highly profitable near the support trendline.
Highly recommend HOLD and Stacking $BTC at Binance.
Feel free to comment the altcoin you are holding and we will check it for you!
#BTC #Bitcoin #TechnicalAnalysis #Crypto #BinanceSquare #HODL #170k
