Momentum is building – this could set the tone for the rest of Q4 2025.
Why is this important
For several months, Ethereum has lagged behind Bitcoin $BTC.
This dynamic may now be reflecting.
Liquidity is flowing, ETF inflows are stable, and Layer 2 (L2) activity is increasing.
This is a real change in trend.
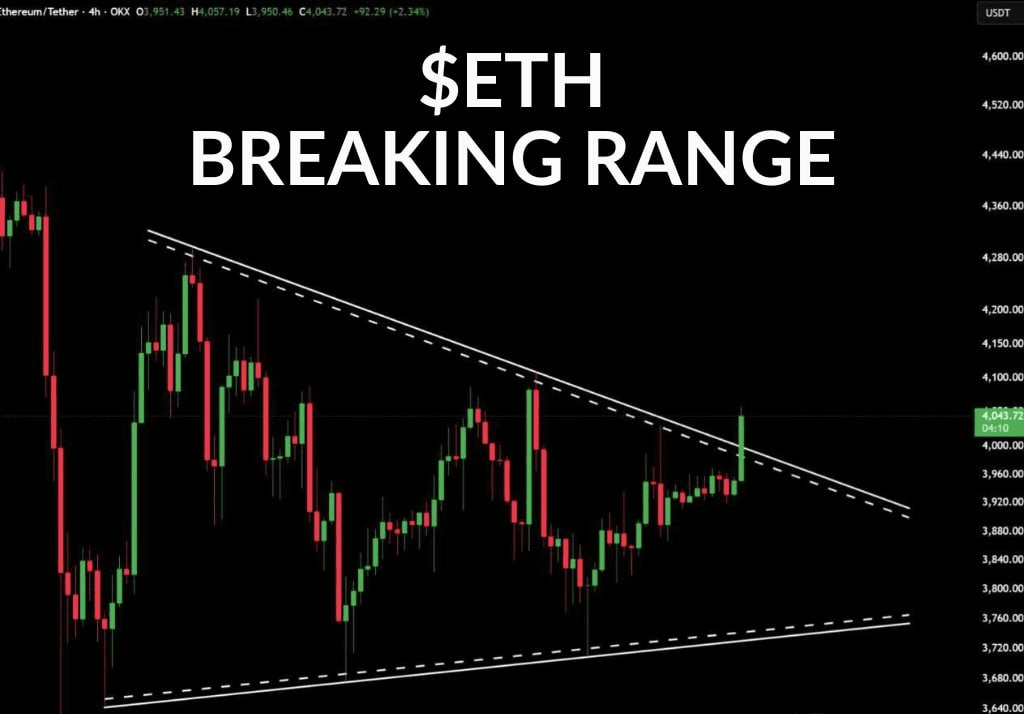
Set up the chart
Ethereum just reclaimed the main 200-day moving average.
The last time this happened (April 2020), Ethereum outperformed Bitcoin $BTC by 45% over the next eight weeks.
> Support area: $3,200–3,300
> Resistance areas: $3,800 → $4,200 → retest of historic high near $4,900
> Above $5,000: price discovery, no historical supply
What this means: as long as Ethereum closes above $3,100, the breakout remains valid.
Fundamentals align
> ETF flows: net positive for 6 consecutive weeks
> Staking yield: stable around 3.3%, indicating network health
> Supply: still contractionary (–0.25% since the beginning of the year)
> Layer 2 activity (L2): +80% year-over-year across Arbitrum, Base, and Optimism
These metrics indicate organic demand and fixed capital.
Cycles to watch
When Ethereum $ETH gains strength, capital tends to rotate to:
> Top 20 altcoins (usually +30–50% lag effect)
> Re-staking, decentralized finance, and AI infrastructure tokens
> Yield-generating layer 2 projects
Simple conclusion: Ethereum $ETH leads → liquidity follows.
Macroeconomic background
Interest rates are stable, risk appetite is improving, and Bitcoin $BTC dominance is flattening.
If this continues, Ethereum may continue to outperform until the end of the year.
Momentum is a signal – not noise.
Ethereum may indicate a return to the beginning of a broader cycle.
If the trend continues, Q4 2025 may belong to Ethereum