Analysis from the perspective of Wyckoff Theory (BNB/USDT Daily Chart)#威科夫供需量价 $BNB
I. Macroeconomic Orientation (SCHO Phase)
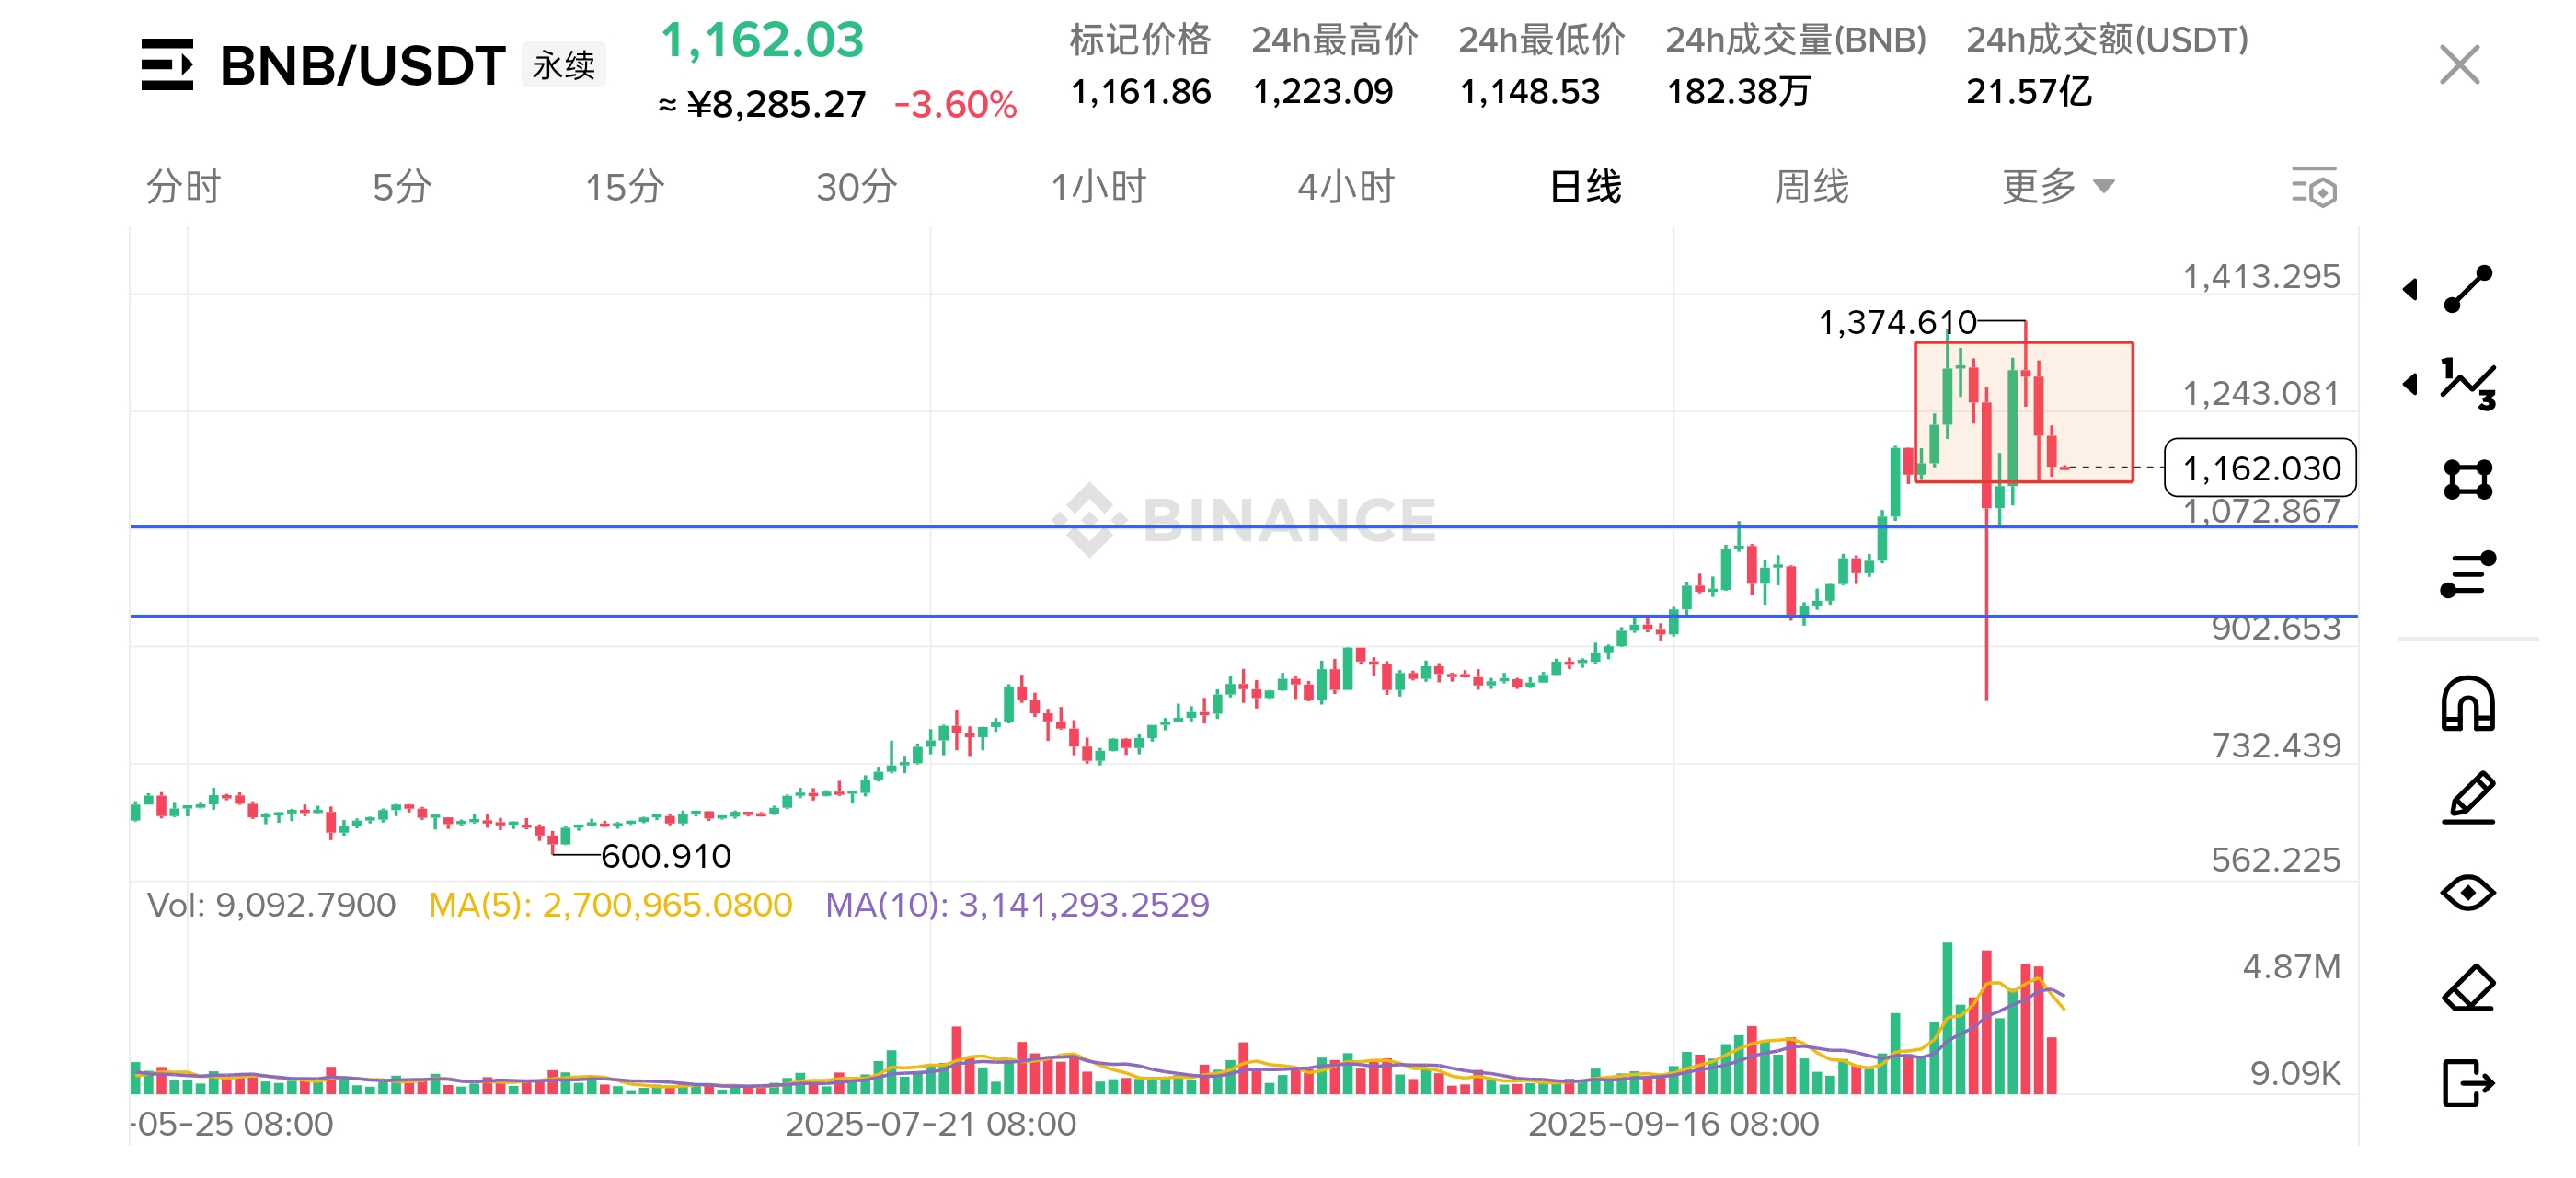
The chart presents the structure of 'Long-term Rise (Markup) → High Oscillation → Deep Pullback': The upward trend starting from 600.91 (consistent with Markup characteristics) rose to 1374.61 and then entered high oscillation, with recent deep pullback, currently in the adjustment phase after the upward trend, it is necessary to be alert to whether it evolves towards the Distribution cycle (due to significant pullback after high oscillation).
II. Micro Analysis (Key Signals and Price-Volume Relationship)
1. Trend Structure and Key Levels:
The pattern of 'gradually raising lows' in an upward trend has been consistently effective, but recently the price broke through the lower edge of the high oscillation range (around 1072.87), forming a 'trend destruction' signal.
During the pullback process, the trading volume significantly increased (corresponding to a huge volume bar of the plunge candlestick), consistent with 'strong effort (huge selling pressure) leading to strong results (deep decline)', suggesting short-term supply overwhelmingly dominates.
2. Verification of the Law of 'Effort and Result':
When it rose to 1374.61, the trading volume did not show 'extreme explosion'; the subsequent pullback volume far exceeded the volume during the previous oscillation stage, indicating 'supply suddenly released, demand insufficient', which is a typical price-volume feature of Distribution or the initial stage of trend reversal.
III. Comprehensive Judgment
Currently in a deep adjustment phase after Markup, and there are signs of evolving towards Distribution. Signal strength is 'strong' - key support has been broken, pullback volume shows 'supply dominant' characteristics, and the core structure of the upward trend has been impacted.
IV. Operation Plan (Personal opinion only, not investment advice)
1. Scenario Prediction:
Scenario 1 (Rebound meets resistance and continues adjustment): If the price rebounds to around 1243.08 (previous support turns into resistance) under pressure, and the trading volume does not increase and break through simultaneously, it is highly likely to continue adjusting, even testing deeper support (such as 1072.87 or 902.65).
Scenario 2 (Breaking resistance to repair trend): If the price breaks through 1243.08 with volume (trading volume significantly exceeds the average pullback volume), then the short-term downtrend may pause and enter the 'trend repair' stage, but it is necessary to be alert to whether it is a 'rebound during distribution' or 'trend restart' (needs subsequent volume-price continuous verification).
2. Key Positions and Operations: (Personal opinion only, not investment advice)
Entry:
"Observe Priority": Current supply dominant characteristics are obvious, aggressive long positions are not recommended; if speculating on a rebound, it can be lightly tried long when the price pulls back to the 1100 - 1150 range and the trading volume decreases (speculating on short-term oversold rebound).
Stop Loss:
Try long entry: Stop loss below 1050 (to prevent deep breakdown risk).
Target:
First target of the rebound: 1243.08 (testing resistance); if broken, look at the 1300 - 1350 range (near previous high).
Simplified operation suggestion: trade within the 1050-1250 oscillation range (personal opinion only, not investment advice)
Short-term cautious, prioritize observing the resistance game at 1243.08. If the price pulls back to 1100 - 1150 with decreasing volume and stabilizes, it can be lightly tried long, stop loss at 1050, target 1230 - 1240; if rebounding to 1243.08 under pressure, after taking profit on the rebound, consider lightly trying to short, stop loss at 1260, target 1120 - 1100.

