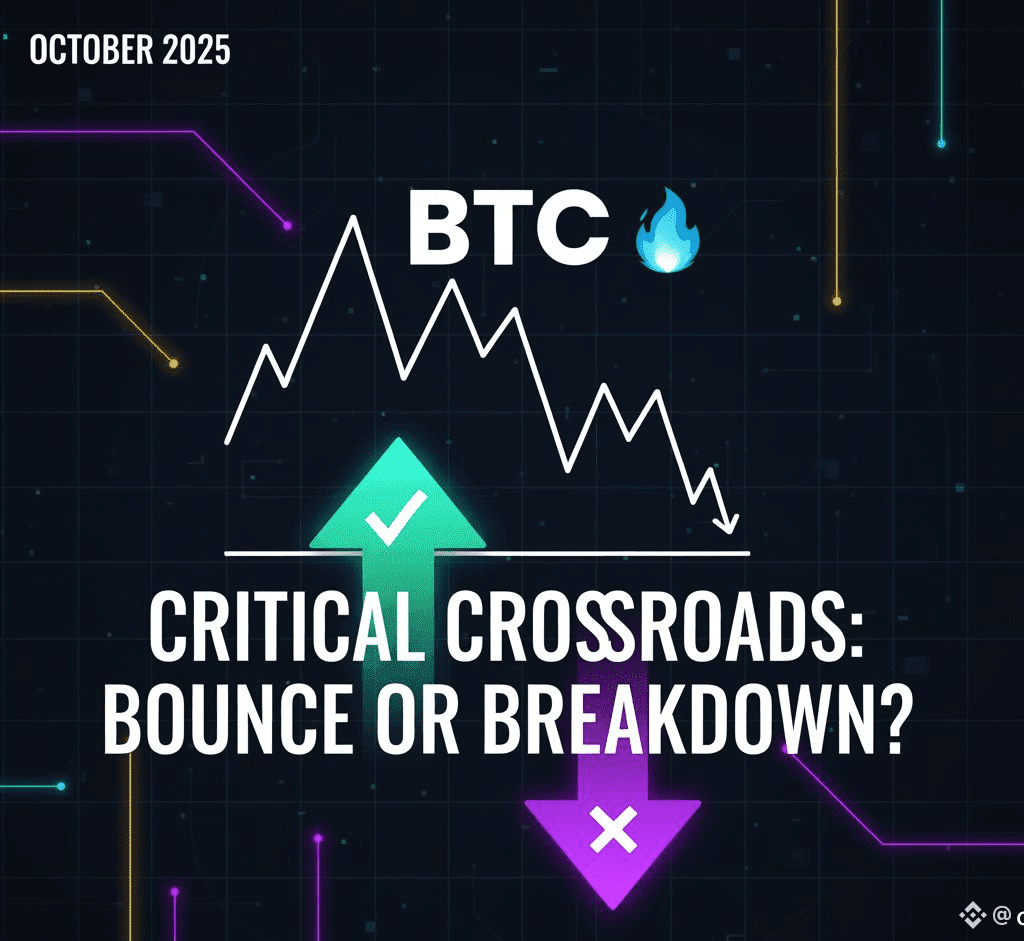
What's up, crypto warriors! Bitcoin just threw us a curveball, and honestly? The charts are looking spicy right now.
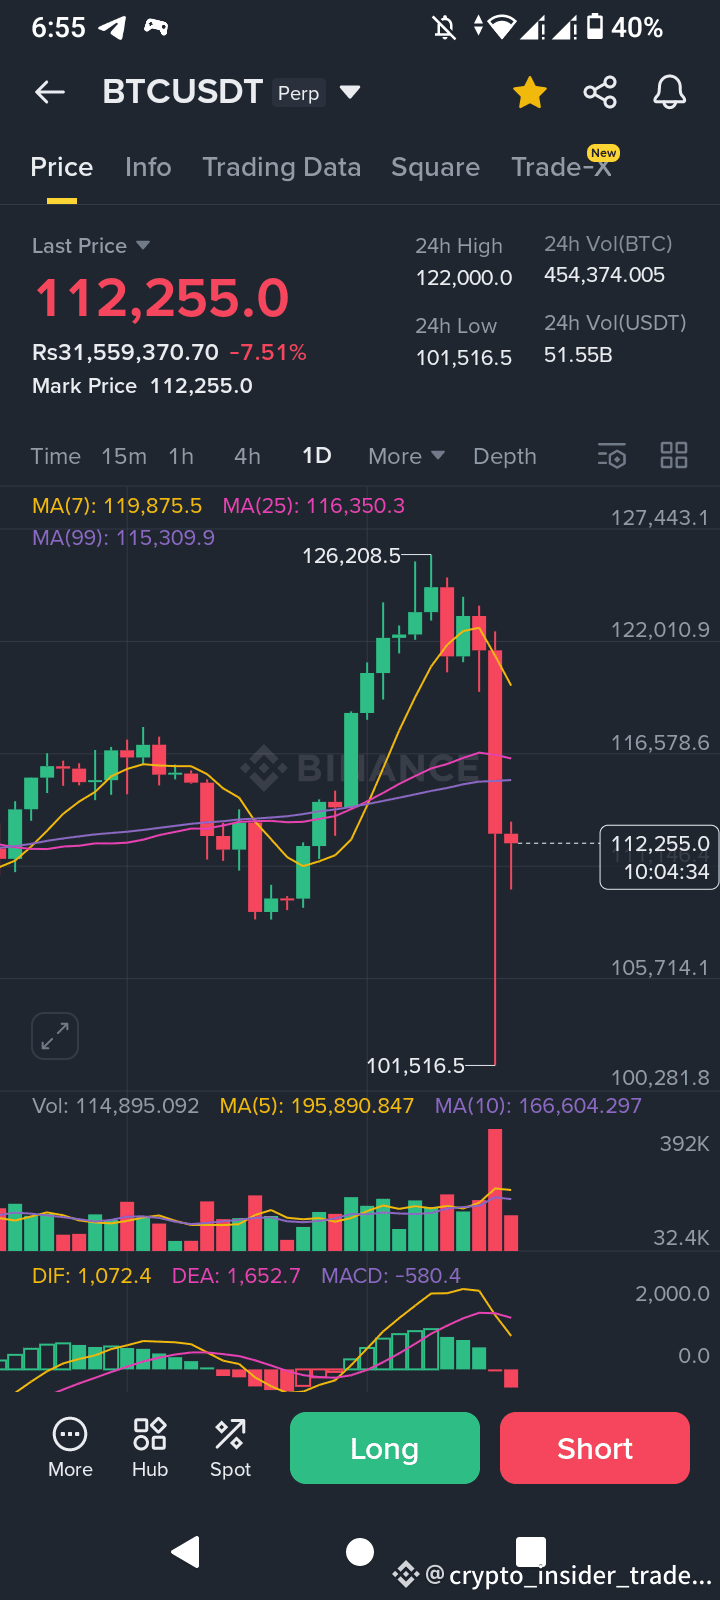
As I'm writing this on October 11, 2025, BTC is sitting at $111,998 – down from a 24-hour high of $122,455. That's nearly a $10K nosedive in a single day, and traders everywhere are asking the million-dollar question: Is this our golden entry point, or the calm before the storm?
Let me walk you through what I'm seeing, no BS—just real talk and actionable insights.
What the Charts Are Screaming
Here's where things get interesting. Bitcoin's been on a rollercoaster since those glorious July highs around $128,902. But lately? The momentum's shifted hard.
➤ The moving averages tell a concerning story:
1. MA(5) at $118,162 is now acting as resistance (yikes)
2. MA(10) and MA(20) are stacking above us — classic bearish setup
3. That death cross forming? Not exactly what bulls want to see
➤ The MACD is basically waving red flags at us. We're seeing negative histogram action at -596, and the bears are clearly running the show right now. Volume spiked to 247K during that recent dump—massive capitulation selling, but here's the kicker: is it exhaustive selling, or just the beginning?
➤ Critical support sits at $101,668 (our 24h low). This level lines up perfectly with September's lows, making it a make-or-break zone. If we crack below that? The psychological $100K barrier comes into play, and trust me, that could trigger some serious panic selling.
➤ Silver lining: The Fibonacci 0.618 retracement level sits right where we are now, and historically, this is often where reversals happen. Plus, with RSI likely in oversold territory, we might be setting up for a bounce.
My Honest Take: What's Next?
Short-term outlook (next 2–4 weeks):
✔ I'm going 60/40 bearish here, not gonna sugarcoat it.
✔ If BTC can't hold above $110K and reclaim that MA(5), we could see more blood.
✔ My downside targets? $95K–$100K range, potentially testing that 200-day MA.
BUT — and this is important — if we do hold support and flip $118K back to support, we could see a violent rally back to $120K–$125K by month's end. Q4 seasonality plus post-halving dynamics historically favor bulls.
Long-term perspective (6–12 months):
◆ Here's where I get bullish. Bitcoin's fundamentals remain rock-solid:
1. Active addresses up 15% year-to-date
2. ETF inflows providing institutional support
3. Halving cycle dynamics still in play
4. Digital gold narrative stronger than ever
Analysts like PlanB are eyeing $200K+ by 2026 if macro conditions improve. That's not hopium—that's based on historical patterns and on-chain metrics.
Watch These Catalysts Closely
➤ Fed decisions on rates (could flip sentiment overnight)
➤ ETF approval news (instant rocket fuel)
➤ Regulatory developments (can tank or pump us)
➤ Global macro conditions (stocks, inflation data)
Bottom Line: What Should YOU Do?
Look, I'm not here to tell you to buy or sell—that's your call. But here's my framework:
If you're bullish:
✔ Wait for confirmation above $118K with strong volume before entering.
✔ Don't catch falling knives.
If you're bearish:
✔ Watch that $101K level like a hawk.
✔ A breakdown with volume could offer lower entry points.
If you're sitting out:
✔ Smart move right now. Sometimes cash is a position.
Whatever you do—manage your risk, use stop losses, and never invest more than you can afford to lose. This market's brutal, and emotions will wreck your portfolio faster than any dump.
Your Turn
What's your gut telling you? Are we about to witness an epic bounce, or is this the start of a deeper correction? I'm genuinely curious what you're seeing in your charts.
Drop your thoughts below—let's figure this out together!
Stay sharp, stay safe, and may your trades be ever profitable
