Now it's already 2025, and domestic ETFs have been approved. Globalization is just a matter of time. There are many U merchants in the market trying to scare you, making you panic with their usual tricks. You don't need to pay attention to that. The key is to consider how to develop the ability to make more money in the cryptocurrency circle before thinking about the withdrawal issue.
When you earn more money, your circle becomes different, and naturally, you can solve the withdrawal problem.
Next, let me talk about how to make more money in the cryptocurrency circle!
First, let me introduce myself. I was born in 1985 and entered the cryptocurrency circle in 2013. I really started to have fun in 2016, and in 2017, I caught the big bull market, earning my first 10 million right from the start. After that, I became reckless, and after losing all the money I earned, I also lost all of my parents' hard-earned savings of over 3 million. I even borrowed 5 million from relatives and friends to trade, and I lost all of that too, paying tuition to the market. In total, I lost over 8 million. My whole family was on the brink of collapse, and my beloved wife was constantly arguing with me about this matter, threatening divorce. Under such great pressure, I thought about jumping off a building a few times. Fortunately, my willpower remained strong at that time, and I believed I could earn it back!
After a few years of adjustment, I began to quit my job and trade cryptocurrencies. I vowed to my wife that if I didn't make the money back... I started to devote myself fully, summarizing the mistakes I had made before, observing the thoughts and techniques of trading experts. Eventually, I began to stabilize; recovering from losses to profits is genuinely not easy! The account began to break even, and by combining contracts and spot transactions, it was no longer about blindly entering and exiting quickly, but rather planning the account well. A combination of medium and short-term trading is the best way to achieve compound growth.
Later, secretly borrowing 200,000 from my wife’s family, I took 2 years to turn that 200,000 into a net worth of tens of millions. Now, with several small goals achieved, my wife looks at me with new respect. From the moment I started making money, I became strong, and my wife became like a well-behaved baby, completely obedient to me!!!
Regarding my own experience, I divide it into four stages based on time.
First phase (2016-2017). The ignorant have no fear, making money until losing rationality. I entered the cryptocurrency space in 2016 (starting to get involved in 2013) and caught the big bull market of 2017. With a capital of 100,000, I reached over ten million at the peak. Two currencies that left a deep impression are one, GXS, participated in the private placement of 2 BTC, which was 6000 each at that time, and opened at 3 million. The other is Antshares (later renamed NEO), bought 10,000 pieces at a unit price of one, which rose to over 1,000, meaning a single currency exceeded ten million. Then I became complacent, thinking, why not set a small goal, earn 100 million, and then stop playing. Then... it turned into a story of someone filled with desire, feeling invincible, being taught a harsh lesson by the market.
Second phase (2018-2019). Reflecting on oneself, starting anew. The market entered a downward cycle in 2018. Looking at all the altcoins in hand and the hopeless future, I felt dejected and berated myself daily. However, the market will not open a backdoor because of your pain. Therefore, this phase is more about reflecting on oneself and understanding the market. After a period of adjustment, I realized two things. First, no one is superior; we are all ordinary people. The reason I made money in 2017 was not because I was great, but simply because the market was good, and I was lucky to stand on the right side of the trend, to put it bluntly, a pig taking advantage of the wind. The second lesson is about controlling funds. Small funds have their way of playing, and large funds have theirs. You cannot use the mindset of small funds to play large funds; otherwise, you will face severe losses. After coming to this understanding, I tidied up my emotions and reallocated my assets, clearing out most altcoins in exchange for BTC, ETH, and USDT.
The third phase (20-21). Reasonable allocation, timely profit-taking. After a full cycle of bull and bear markets, the mindset becomes much calmer. Moreover, the cryptocurrency market has entered a new rising cycle, so assets begin to appreciate continuously. At this time, what is done more is actually profit-taking and continuous reallocation. Therefore, relatively speaking, it is not as dramatic as in 2017. Perhaps it's because of getting older, feeling that simplicity is the true essence.
Fourth phase (2022-?). Cultivating internal skills, believing in the future. I have firm confidence in the future of the cryptocurrency market; surpassing previous highs is inevitable. For now, we only need to do one thing: do not exit the market, keep holding quality assets, and in the future, we will surely reap a bountiful harvest.
(Six Major Rules of Cryptocurrency Market)
One, only participate in the irreversible upward trend of the market.
"Only participate in the irreversible upward trend of the market." The market is a fact; it is unquestionable and cannot be challenged. The trend is irreversible. As investors, we must dare to admit mistakes, correct them at any time, reject uncertain market conditions, and engage in trends that even market makers must follow. We must understand to go with the trend.
2. Reject frequent trading.
The casino is open 24 hours a day; there is no need to frequently open orders. There are many logics such as timing, trial and error, and position control. We advocate waiting for the perfect opportunity like a hunter rather than randomly investing at the sight of prey.
Three, do not blindly trust technical indicators.
First, we must acknowledge that any technical indicator has its lagging nature. For example, when the MACD indicator issues a golden cross buy signal, the currency has already risen a wave by that time, and when the golden cross occurs, it is very likely that you are just taking over the position!
Four, buy and forget the cost price.
When you short or go long, your cost price is irrelevant to any subsequent operations, because whether to sell depends on market trends, which has nothing to do with whether you are still profitable. If the pattern is good, continue to hold; if the pattern is bad, reduce your position or even clear your position.
Five, participate with money you can afford to lose.
Investing in cryptocurrencies with spare money involves risks. Investors can increase their investment after mastering the secrets to profit. Before that, always use funds you can afford to lose. Borrowing money often leads to heavy losses!
Six, if profitable, cash out on time.
Without cashing out, everything is just numbers. Investors in the cryptocurrency space are like gamblers who have not left the casino. Even if they temporarily make a lot of money, they still cannot be considered winners. Only when you extract cash from the market can you say that you laughed until the end. In the cryptocurrency world, withdrawing on time is a good habit.
From losing 8 million to having over 200 million in wealth, mastering wealth password technology—mastering these technical indicators MA and MACD, Boll and RSI, mastering them will easily lead to tens of millions! (Pure dry goods, suitable for everyone, easy to learn, straightforward) Must collect!

One, explanation and application of the MA moving average indicator.
The MA indicator, also known as Moving Average, calculates the average price within its numerical scope. For example, MA5 represents the average price of 5 time periods (including the current one) of the candlestick chart, regardless of whether it is at the minute, hour, or day level. A smaller MA number indicates higher volatility, focusing more on short-term fluctuations, while a larger MA number indicates slower volatility, focusing on long-term trends.
The MA numbers can be set according to personal preference. Here, I share two MA trading methods I commonly use, namely the Vegas channel and the squeeze channel.
Vegas channel.
The Vegas channel, its simplified explanation is using the 144 and 169 moving averages to judge medium to long-term trends. This method is not suitable for periods shorter than 15 minutes and is applicable for periods over 1 hour.
Why use these two moving averages?
Upon careful observation, we can see that 144 and 169 are the squares of 12 and 13, respectively. This principle subtly implies Gann's square theory and the Fibonacci sequence. Specifically, the number 144 comes from Gann's square theory, while the number 169 is the square of the Fibonacci sequence number 13. Only when the two are combined can they achieve a better application effect in practical use.
Example explanation:
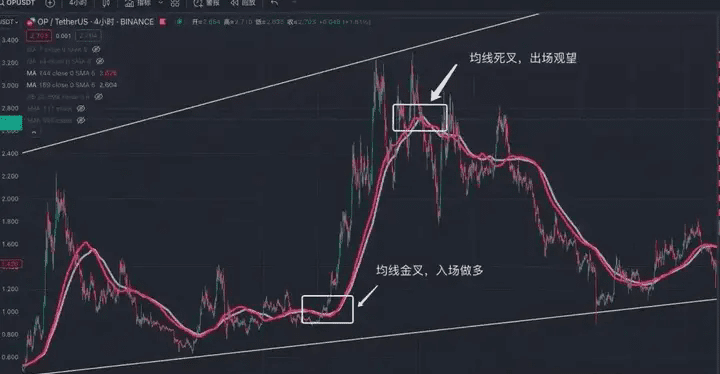
Taking the 4-hour trend of OP as an example, when the 144-day moving average crosses above the 169-day moving average, a golden cross forms (the golden cross indicates that the 144 moving average crosses above the 169 moving average), indicating a bullish outlook for the medium to long term, and one can try to enter. When the price reaches the top, the 144 moving average crosses below the 169 moving average, forming a death cross (the death cross indicates that the 144 moving average crosses below the 169 moving average), thus suggesting a wait-and-see approach for the medium to long term.
Some may ask, isn't this too absolute? How do you explain the frequent golden and death crosses of moving averages before the consolidation? Isn't that gambling?
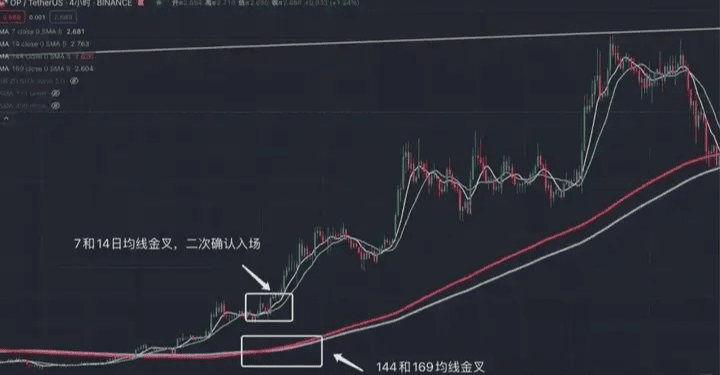
Here, my suggestion is that since the 144 and 169 moving averages cannot determine short-term trends and have strong lagging characteristics, it is suggested to add 7 and 14-day moving averages for auxiliary judgment of short-term trends. Let’s further enlarge OP’s trend, judging medium to long-term market changes with larger MA moving averages, and then confirming with smaller MA moving averages when they cross golden.
The Vegas channel is used to judge medium to long-term trends. Due to the lagging nature of the Vegas channel, it still needs to be paired with short-term moving averages for auxiliary verification. In a strong market, the 144 and 169 moving averages must rise. If the price consolidates near the 144 and 169 moving averages, it indicates that the short-term market is weak and is not suitable for entry. At the same time, the 144 and 169 moving averages have good support and resistance effects, suitable for ultra-short-term rebounds and other operations.
Squeeze channel
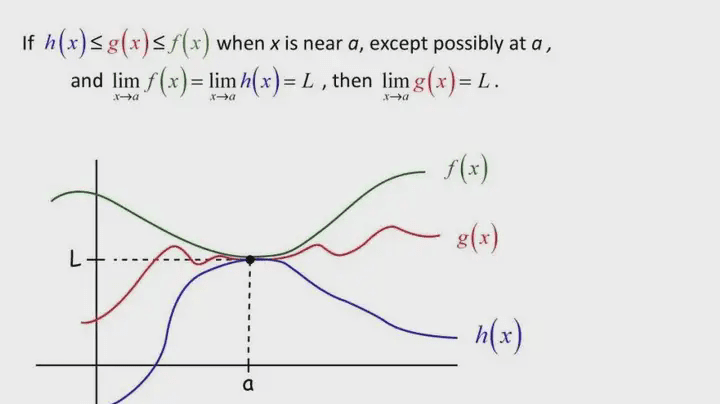
The squeeze channel mainly comes from the mathematical squeeze theorem. Its simplified explanation is that if a function is 'squeezed' by two other functions near a certain point, and these two functions have the same limit, then the limit of this function will also tend to the same value.
In secondary market trading, we can also apply a similar squeeze theorem model. We can simplify it to two moving averages, 111 and 350. Due to the longer cycle of the 350 moving average, it is recommended for short-term trading.
Why these two moving averages?
Dividing 350 by the 111 moving average, the number we get is closest to pi, which is 3.15, or we can say that dividing 350 by 3.14 gives us the closest number, which is 111.
Example explanation:
Taking the 1-hour trend of TRB as an example, when the blue line (350) moving average is above, and the yellow line (111) moving average is below, forming a triangular shape, it indicates a successful 'squeeze.' After the success, the subsequent trend looks bullish. However, it is important to note that a correct 'squeeze' pattern requires the 111 moving average to cross above the 350 moving average. If only one side crosses, it does not count.
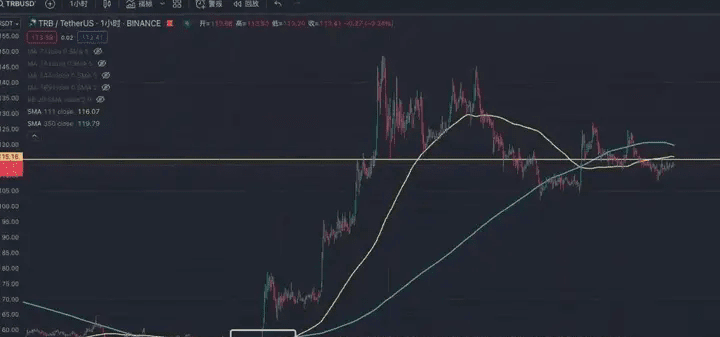
This channel is suitable for 1 hour and 4-hour levels, but the accuracy is generally low. However, once successful, the subsequent trend will be a large-scale market. Therefore, when a squeeze pattern appears, we can pay extra attention. We can also use other technical indicators for auxiliary judgment.
Advanced use of MACD and MA
Besides the basic MACD and MA usage, just knowing these is far from enough. Ultimately, these technical indicators' usage can be found through public data. Many main players and market makers will deliberately create 'false trends' to make you think that if you don't buy now, you will miss out. In reality, it's just a trick to lure you in.
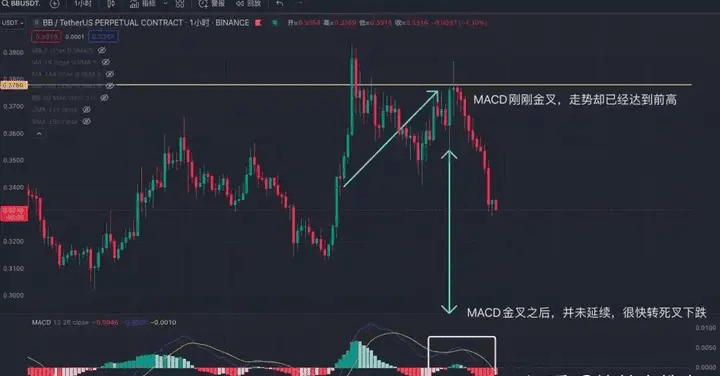
How to prevent and identify these 'false trends'?
False trends mainly guide beginners into the market through the MACD golden cross. Taking the 15-minute trend of BB as an example, when the 15-minute trend breaks through a new high, it quickly drops. The MACD enters a death cross, indicating a correction has begun. However, during the correction, the trend is quickly recovering, even approaching the previous highs, but at this time, the MACD has just started its golden cross. We can understand this trend as 'having the heart but lacking the strength,' meaning the price has rebounded to the previous high while the MACD has only just crossed golden. More than 80% of the results from this type of trend will look like the chart; the strength fades quickly.
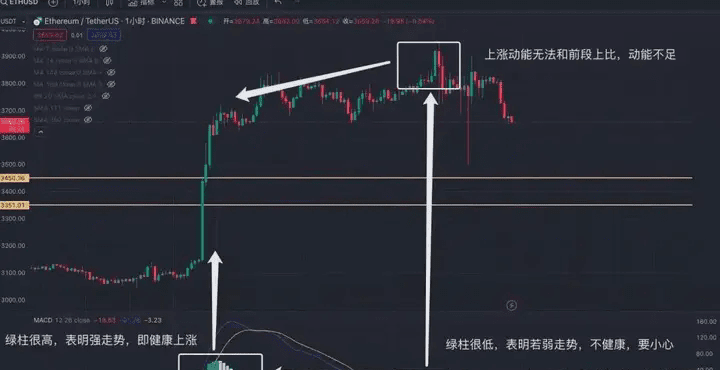
Next, taking the 1-hour trend of ETH as an example, the MACD golden cross occurs, and the green bars rise sharply, causing the price to follow upward. This type of increase is a quality surge, indicating that entry is possible. Then the price enters a consolidation phase, and the MACD turns to a death cross. After the adjustment, the MACD enters a golden cross, but the rise and trend do not continue as before; instead, the upward momentum is weak, and the MACD volume bars are not in a state of continuous increase. This state of 'hanging by a breath' is very dangerous. Although the MACD golden cross occurs, the strength is not strong, and the longer this continuous state lasts, the more dangerous it becomes. When the price breaks through a new high but the MACD does not reach a new high, we call this 'top divergence,' which is a strong sell signal. Similarly, when the price breaks through a new low but the MACD does not reach a new low, we call this 'bottom divergence,' which is also a buy signal.
Boll and RSI indicators
BOLL (Bollinger Bands)
BOLL is a very simple and practical technical analysis indicator designed by U.S. stock analyst John Bollinger based on the statistical principle of standard deviation. I personally believe it is very useful in the secondary trading of blockchain.
BOLL consists of three lines: upper, middle, and lower. The upper, middle, and lower Bollinger Bands have meanings of resistance and support. When several prices reach the upper Bollinger Band, they will retrace due to pressure, and when reaching the lower Bollinger Band, they will rise due to support. When the stock price rises above the upper Bollinger Band, it indicates overbought conditions with a possibility of retracement, also indicating that this stock is very strong. Conversely, when the stock price falls below the lower Bollinger Band, it indicates oversold conditions, also representing extremely weak market conditions. When the stock price drops from the upper Bollinger Band to the middle band, the middle band acts as support. If it falls below the middle band, it becomes a resistance level. When the stock price rises from the lower Bollinger Band to the middle band, it also faces resistance. Breaking through the middle band and stabilizing indicates that the resistance level turns into a support level.
Here are the 10 golden basic principles of Bollinger Bands, which are very important:
1. When the price breaks through the upper band, beware of a retracement.
2. Beware of a rebound when the price falls below the lower band.
3. Strong trends are always above the middle band.
4. Weak trends are always below the middle band.
5. The narrowing of the upper and lower bands hides a sudden change.
6. The larger the opening, the greater the momentum of the market.
7. The middle band guides the trend direction.
8. A sudden narrowing of the channel indicates a reversal.
9. The channel suddenly opens and consolidates no longer.
10. The longer the channel narrows, the smaller the opening, the more obvious and drastic the changes in the market will be.
Example explanation:
Taking the 1-hour trend of BTC as an example, BOLL mainly consists of three lines: upper band, middle band, and lower band. When the price exceeds the upper band, it indicates overbought conditions, and the probability of a retracement is high. When the price falls below the lower band, it indicates oversold conditions, and the likelihood of a rebound is high.
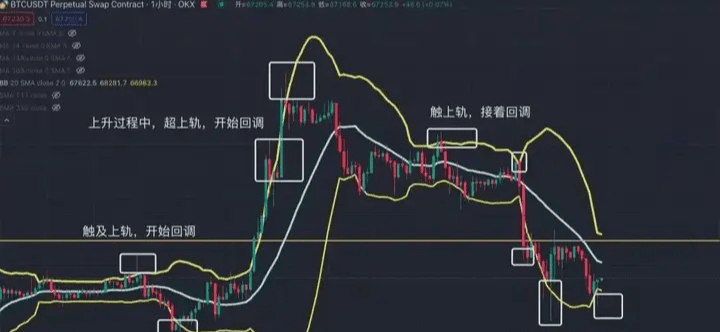
Next, taking the 1-hour trend of TRB as an example, when the BOLL band narrows, it indicates that extreme market conditions are about to occur. However, BOLL cannot accurately determine the specific direction and requires other indicators for auxiliary judgment. The longer the narrowing time, the shorter the BOLL band, indicating that future market conditions will be more intense. At the same time, in a strong upward market, BOLL will gradually rise along the middle band, while in an extremely strong market, BOLL will continuously rise above the upper band. Conversely, in a weak market, BOLL will fall along the middle band, at which point the middle band will shift from a support level to a resistance level. In an extremely weak market, BOLL will continuously fall below the lower band.
RSI (Relative Strength Index)
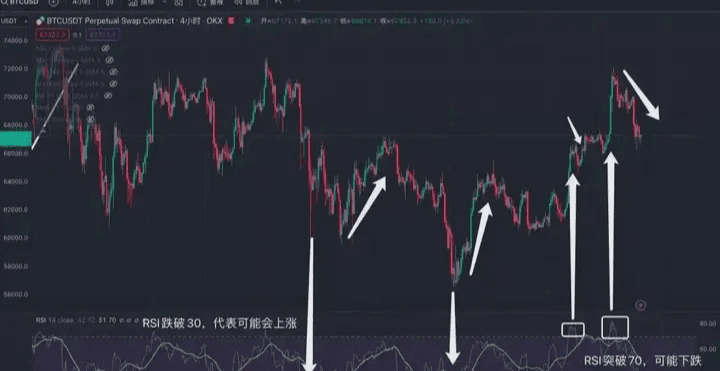
RSI (Relative Strength Index) operates by calculating the magnitude of price changes to infer the strength of market trends, predicting the persistence or reversal of trends accordingly. The RSI value fluctuates between 0-100, meaning the price will never exceed this range. We can simplify it to understand that when RSI reaches 70, it indicates that the market is overbought, with increased retracement risk. Conversely, when RSI falls below 30, it indicates that the market is oversold and may rise.
Example explanation:
Taking the 1-hour trend of BTC as an example, when the RSI falls below 30, it indicates that consolidation and retracement are needed, and this retracement is not absolute; it only represents that the market condition is very weak and cannot serve as a direct basis for buying. Secondly, when the RSI breaks above 70, it indicates overbought conditions, which may carry retracement risks. However, this still cannot serve as a basis for buying or selling, only as an auxiliary judgment. Note: In extreme market conditions, the RSI can reach 99 or 1, so do not use RSI as the main judgment criterion.
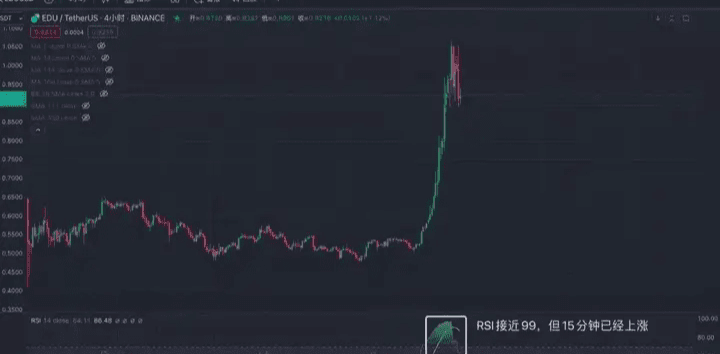
Next, taking the 4-hour trend of EDU as an example, after the RSI breaks 70, it continues to rise, ultimately reaching 99. Therefore, we cannot use the method of buying at 30 and selling at 70. We need to determine the nature of the stock/currency, whether it is a small-cap, MEME-type currency, or a highly controlled currency. Compared to blue-chip currencies, the RSI judgment for other small currencies may need to be raised to the range of 90 and 10, rather than 30 and 70, which requires personal judgment.
Three, variations of the flag pattern consolidation.
Flag pattern consolidation, also known as triangle consolidation, is not based on indicator judgment but rather on the changes in the K-line trends. We can summarize it into 16 common basic change types. If we see a similar trend, we can buy in, and generally, the success rate is high, looking bullish afterwards. However, there are also times when it fails. It is recommended to buy at the low points of the flag pattern. When breaking through the triangular area upward, the breakout area becomes a support level, and in the future, when it falls, one can re-enter near the support.
Example explanation:
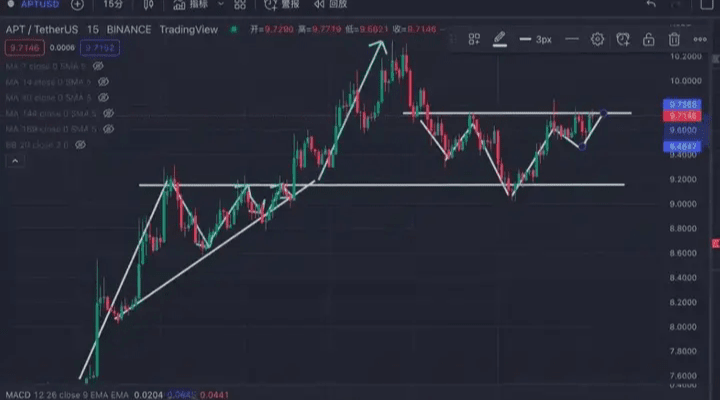
Taking the 15-minute trend of APT as an example, its trend perfectly replicates the third and tenth patterns shown above. However, it is important to note that this is just a successful case; many main players and market makers will deliberately create similar patterns to deceive people into entering the market. We need to be cautious and identify them or cut losses in time.
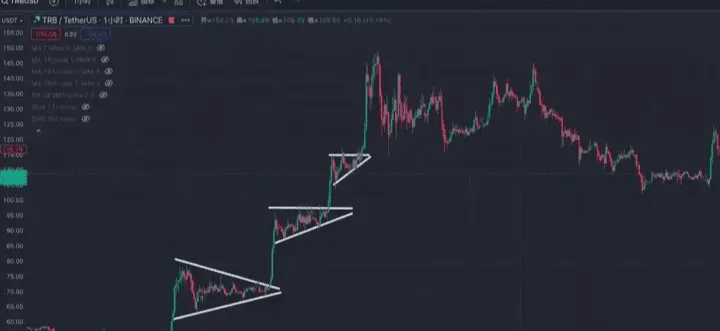
Let’s take the 1-hour trend of TRB as an example. We observe that TRB has used the three-week flag pattern to achieve a threefold increase in a week. So when we see similar trends in the market again, we can draw them out for verification.
Remember these 15 points when trading cryptocurrencies; they can help you avoid detours in the cryptocurrency market!
1. Luck and hesitation: Luck is the culprit of increased risks, while hesitation can cause missed opportunities.
2. If long-term is gold and short-term is silver, then swing trading is diamonds.
3. Never easily go all in at any time; this helps maintain a calm mindset and allows you to attack when opportunities arise and retreat when necessary.
4. Catch fish in the middle section, leaving the heads and tails for others.
5. Frequent operations will inevitably lead to total loss; indecision leads to slow bleeding.
6. The mindset of trading cryptocurrencies comes first, strategies second, and techniques only come third.
7. Markets are born in despair, develop in hesitation, and end in madness.
8. Greed is the eraser of profits; greed and fear are major taboos in investment.
9. Opportunities come from declines; trading cryptocurrencies is about the future, cash is king.
10. Buying relies on confidence, holding relies on patience, and selling relies on determination.
11. There are no absolutely accurate indicators, only half-knowledgeable retail investors. Indicators are useful to those who know how to use them, but harmful to those who do not.
12. Not cutting losses in cryptocurrency trading will lead to significant losses.
13. When others are fearful, we should be greedy; when others are greedy, we should be fearful.
14. Beginners look at price, experienced traders look at volume, and experts look at momentum.
15. Preserve capital, control risks, earn profits, and maintain stable long-term profitability.
This is the trading experience that the instructor shares with everyone today. Often, many profitable opportunities are lost due to your doubts. If you do not dare to try boldly, to touch, to understand, how can you know the pros and cons? You can only know how to proceed with the next step after taking the first step. A cup of warm tea, a piece of advice, I am both a teacher and a friend you can talk to.
Meeting is fate, knowing each other is a bond. The instructor firmly believes that fate will lead to a meeting, while parting ways is destiny. The journey of investment is long; temporary gains and losses are just the tip of the iceberg. One must understand that even the wisest can make mistakes; the foolish may gain from their foolishness. Regardless of emotions, time does not stop for you. Pick up your worries, stand up again, and move forward.
I am Old Chen, having experienced multiple bull and bear cycles with rich market experience in various financial fields. Follow Old Chen here to penetrate the fog of information and discover the true market. Seize more wealth opportunities and identify truly valuable opportunities; don’t miss out and regret it!
Giving someone a fish is not as good as teaching them how to fish. Cryptocurrency investors, whether beginners or experts, gain not only financial benefits but also growth in investment knowledge and experience through the instructor. In the process of following Old Chen's investment journey, Old Chen will not only provide analysis ideas for market trends, basic knowledge for watching the market, and usage methods for various investment tools, but will also bring exciting fundamental interpretations, clarifications of chaotic international situations, and identification of various investment forces. This will enable you to become both a winner and an expert in investing!
In the cryptocurrency market, mastering the seven major trading principles is essential to understanding investment risks and rewards, allowing one to be stable in the wind and turn danger into safety. Old Chen has been navigating the market for many years, deeply understanding its opportunities and pitfalls. If your investments are not going well and you feel dissatisfied with your losses, you can contact Old Chen, and I will correct your past mistakes. If you are currently profitable, I can teach you how to maintain your profits. If you are still lost and confused in the market, I am willing to guide you forward. The real tragedy of trading does not lie in how much pain you suffer but in how many opportunities you miss! Seize the present and move forward together. I am Old Chen, a person who aims to leave a name in the cryptocurrency market.


