🔥 TUT/USDT – The Calm Before the Storm? A Massive Move Could Be Coming! 🔥
The crypto market never sleeps — and neither does opportunity. One coin that’s quietly been building strength while most people weren’t paying attention is TUT/USDT.
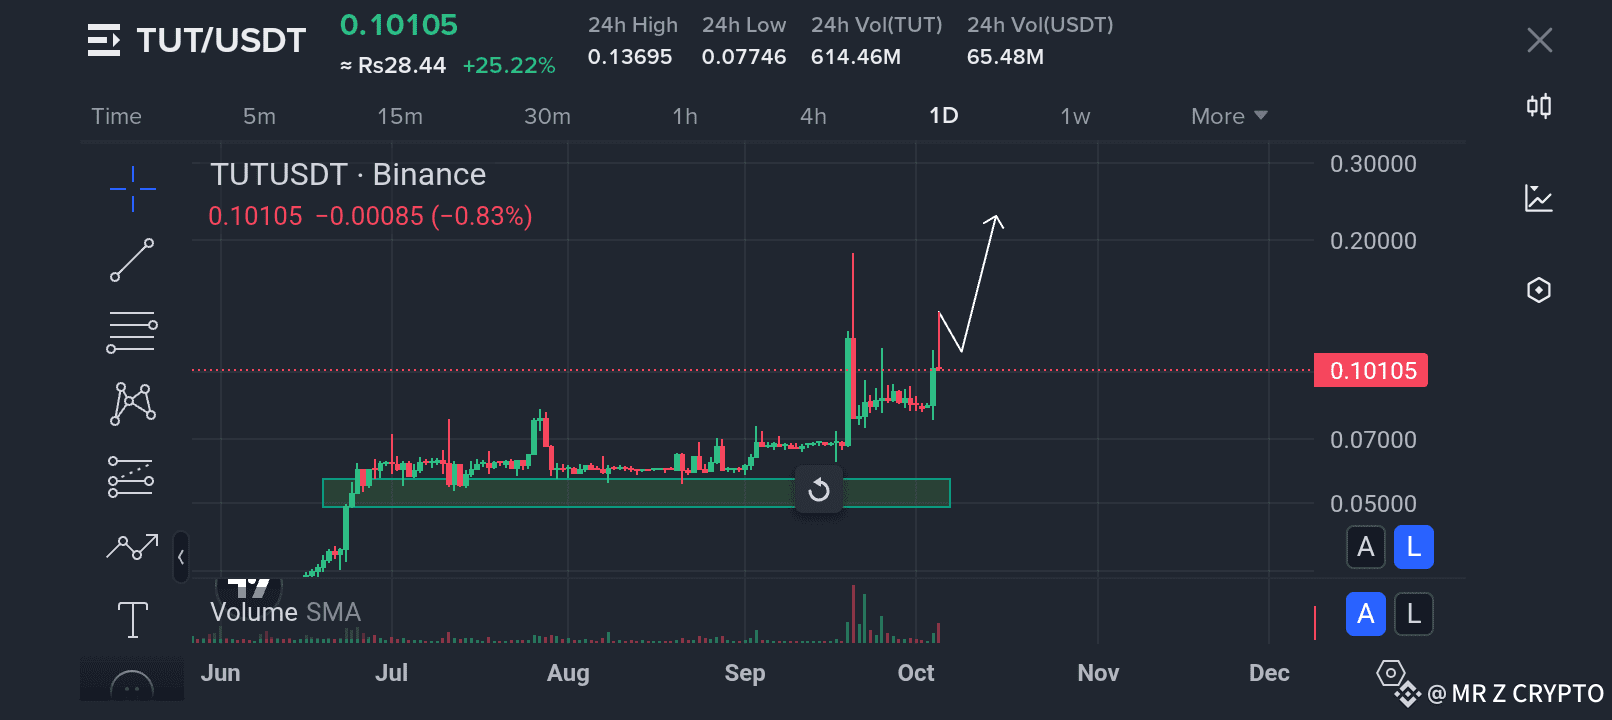
Over the last few months, TUT has been forming one of the cleanest consolidation patterns on the Binance chart. For weeks, it stayed trapped inside a tight range between $0.05 and $0.08, where strong hands were accumulating while weak hands were selling off.
But just recently, everything changed.
The breakout candle we’re seeing now could be the first major signal of a new bullish phase. 📈
Let’s break it down in detail 👇
🧩 1. The Technical Picture
Looking at the daily timeframe, the structure is becoming crystal clear:
TUT broke above its long-term resistance zone.
The volume spiked dramatically, showing strong buying pressure.
Price touched a 24h high of $0.1369, signaling renewed investor interest.
After a brief pullback, the price is holding above $0.10, which has now turned into support.
This kind of move often happens before a big leg up. The market is testing liquidity, shaking out short-term traders, and preparing for the next surge.
🚀 2. Why This Breakout Matters
This isn’t just another random price spike. The data shows something deeper:
Trading volume has surged to over 614 million TUT — that’s a strong confirmation of real market participation.
The price increase of +25% in 24 hours is not just volatility; it’s momentum.
The chart shows a bullish breakout followed by a healthy retest, which often leads to strong continuation moves.
If TUT can hold above the key zone of $0.10, the path upward becomes much clearer.
🎯 3. Potential Targets
Based on the current structure and volume dynamics, here are the next major resistance zones traders will be watching:
✅ Target 1: $0.15 – first resistance, where partial profit-taking may occur.
✅ Target 2: $0.20 – a psychological and technical barrier.
✅ Target 3: $0.30 – long-term target if momentum continues and the market sentiment stays bullish.
If we break and close above $0.15 with volume, the next wave could push much higher than most expect.
💡 4. The Smart Money Perspective
During long consolidation phases, large investors — or smart money — quietly build positions. That green zone on the chart from June to September was likely a heavy accumulation area.
Now that price is moving up, those early buyers are sitting on strong profits, and new buyers are entering at higher levels, driven by FOMO (fear of missing out).
The pattern we’re seeing is classic:
Accumulation → Breakout → Retest → Expansion.
We’re currently in the retest/expansion phase.
⚠️ 5. A Quick Reality Check
While everything looks promising, no chart is ever 100% certain. There’s always risk.
So, before jumping in, remember these golden rules:
Always set a stop-loss.
Never invest more than you can afford to lose.
Wait for confirmation candles before major entries.
Smart traders don’t chase the hype; they ride the trend with discipline.
💬 Final Thoughts
TUT/USDT is currently trading around $0.101, and all signs are pointing to potential upside momentum. The project seems to be gaining traction, and the technical setup is aligning perfectly for a bullish breakout.
📊 The chart is whispering one thing to those who can read it: “The move hasn’t even started yet.”
The coming days could be crucial for this coin. If the bullish momentum holds, we might witness a breakout that shocks many.
✨ Stay alert. Stay patient. Stay ready. ✨
Because sometimes, the quietest charts create the loudest profits.
#TUT #CryptoBreakout #Binance #AltcoinNews #TechnicalAnalysis #TradingSignals #CryptoMarket #BullishMomentum #TUTUSDT