$XRP is showing strong bullish signs after a lengthy consolidation period. Technical patterns hint that the coin might be gearing up for one of its biggest moves in years.
Ripple's XRP has grabbed attention once again. After spending years moving sideways, the cryptocurrency is now displaying technical signals that often come before major price surges.
✨XRP Technical Analysis
Crypto trader Amonyx recently teased an "insane breakout," and the chart seems to support that bold claim.
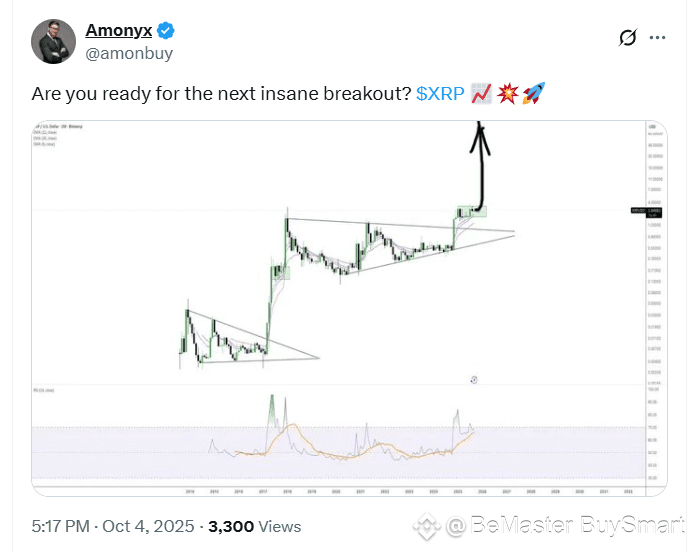
On the long-term monthly chart, XRP has broken out of a large symmetrical triangle—a pattern that's historically led to strong upward moves. This places XRP in what looks like a decisive bullish position. The support zone sits between $1.50 and $2.00, an area that once acted as resistance and now provides a solid floor. Near-term resistance appears around $2.50 to $3.00, while the chart projects a target of $4.80 or potentially higher if momentum holds. The RSI shows bullish strength but hasn't hit extreme levels yet, suggesting there's still room to run before the market gets overheated.
✨Why This Rally Matters
A few factors are lining up in XRP's favor. Ripple's partnerships with banks and payment networks are fueling optimism about real-world adoption. There's also been some regulatory progress in the U.S. that's boosted investor confidence. Plus, with Bitcoin leading the market higher, altcoins like XRP tend to follow with delayed but often explosive rallies—it's a pattern we've seen play out before.
🚀🚀🚀 FOLLOW BE_MASTER BUY_SMART 💰💰💰
Appreciate the work. 😍 Thank You. 👍 FOLLOW BeMaster BuySmart 🚀 TO FIND OUT MORE $$$$$ 🤩 BE MASTER BUY SMART 💰🤩
🚀🚀🚀 PLEASE CLICK FOLLOW BE MASTER BUY SMART - Thank You.
