(In-depth study relying on advanced technical tools + reading short, medium, and long-term trends)
🟢 Current price position
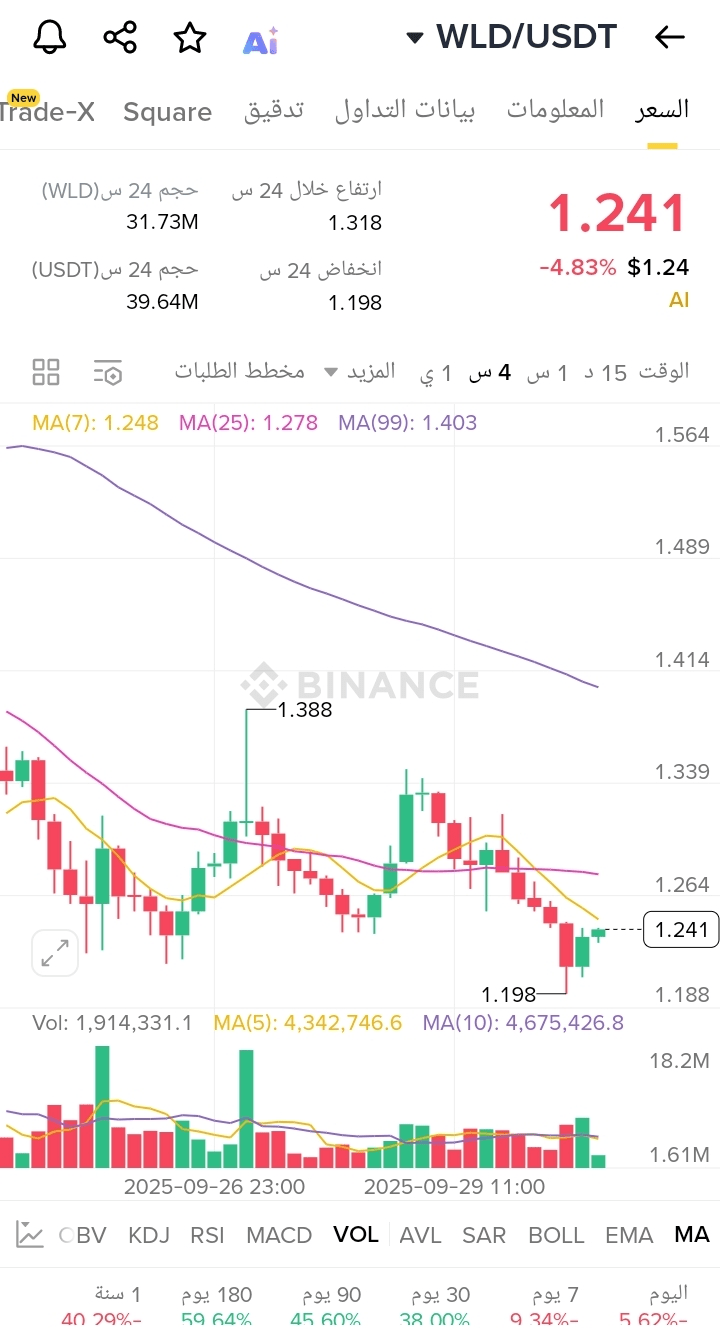
Current price: 1.241$
Daily change: -4.83%
24-hour trading range: 1.198$ – 1.318$
Trading volume: 31.73M WLD / 39.64M USDT
🔍 Technical analysis using advanced tools
1️⃣ Moving Averages
MA(7) = $1.248: A momentary resistance pressing on the price.
MA(25) = $1.278: An average barrier that determines the continuation of the decline or the beginning of a rebound.
MA(99) = $1.403: Represents the main long-term trend, and a breakout upwards is a signal of a reversal in the overall path.
📌 Reading: The price is currently trading below all averages → a signal that the medium and long-term trend is still downward, but the proximity of the price to MA(7) means the possibility of a quick corrective move.
2️⃣ Advanced technical indicators
RSI (Relative Strength Index): Moves in the range of 40 – 45 → still below the neutral area (50), meaning that selling momentum is dominating, with the possibility of a short-term rebound.
MACD: The histogram is negative and the fast line is below the slow line → the downtrend continues but with signs of weakness in selling momentum.
KDJ: Gives a signal of potential corrective rebound as the price enters a strong support area.
OBV (On-Balance Volume): The fluctuation reflects limited accumulation at support areas.
3️⃣ Volume Analysis
Liquidity has increased significantly at the level of $1.198 → this level represents the Demand Zone.
Weak liquidity during attempts to rise above $1.27 → means that buyers are waiting for lower levels to buy, which slows down the rebound.
4️⃣ Key Levels
First support: $1.198
Second support: $1.150
Strong support: $1.05 (a potential historical level if the decline continues)
First resistance: $1.278
Second resistance: $1.338
Central resistance: $1.403 (matches with MA99 – a key for trend change)
⏳ Reading the currency's time path
📍 Short-term (Days – Weeks):
If the price maintains support at $1.20 → we expect a rebound towards $1.27 – $1.30.
Breaking $1.20 → decline towards $1.15, with the risk of selling acceleration.
📍 Medium-term (1 – 3 months):
The trend is sideways – down as long as the price is below $1.40.
Any real breakout above $1.40 will push the currency into the range of $1.56 – $1.70.
📍 Long-term (3 – 12 months):
The overall picture is still weak, but if the price maintains the area of $1.15 – $1.20 and strong demand builds on it, we could see a gradual return towards levels of $2.00 – $2.50.
Staying below $1.15 for long periods → means that the currency will enter a long-term distribution phase.
🎯 Summary for investors and traders
For short-term speculators:
Trading between $1.20 – $1.30 is possible, but with strict risk management.
For medium-term investors:
Waiting for a breakout above $1.40 before any significant entry.
For long-term investment:
Dollar-Cost Averaging (DCA) at support areas $1.15 – $1.20 could be strategic, provided that patience is maintained and waiting for a new liquidity wave.
⚠️ Professional advice: The market is still in the process of building a price base, so the best strategy now is to wait + enter small positions instead of full entry.
Prepared by Dr. Ghassan #crypto_Alarab
📝 Reference analysis
This report combines:
RSI – MACD – KDJ – OBV – Moving Averages – Volume Analysis
#BinanceHODLerEDEN #MarketRebound #BTCPriceVolatilityNow #Write2Earn