The essence of market trading
Lesson Twenty
Today's lesson may give you a new perspective on how to view your candle market trading, possibly giving you a refreshing feeling.
Why do prices rise? Because the actively buying institutions drive the price up; conversely, the actively selling institutions drive the price down.
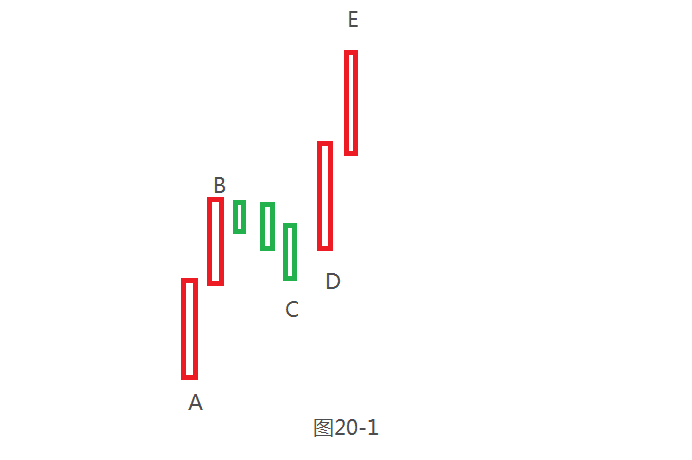
In Figure 20-1, what kind of supply and demand relationship do you see? How does this supply and demand relationship help our trading? Please think about it first before looking at my analysis.
Candles A and B are both medium to large bullish candles, closing at the top. What does this indicate? It indicates that during the price rise, every sell order at each price point was fulfilled by buyers, thus there was no upward supply resistance at these positions. Meanwhile, the trading volume accumulated at each price point from A to B is relatively low, and the trading volume is distributed in a staggered manner, so when the price falls back, it will not produce strong support.
Until the top of B encountered a large amount of supply resistance, causing the price to stop rising. The pullback from B to C is the process of demand absorbing supply. Why do I think so? Because the rapid rise from D to E later reflects a situation of insufficient supply. It can be inferred that the supply from B to C has been absorbed by demand; if the supply had not been fully absorbed, such a rise would not have occurred.
Thus, the interval from B to C has accumulated a large number of institutional buy orders, which is the focus we need to pay attention to. Because these buy orders need to be sold at a high price to realize profits, but due to the large number of institutional buy orders, it is unlikely that they can all be sold at once. When the price falls from a high level to this interval, since there are still institutional cost buy orders that have not been sold, institutions need to invest funds again to push the price up to the high level for unloading. At the same time, this interval is also a position that other institutions pay attention to. They know that institutions will go long here, and they will also set large buy orders here, so when the price falls back here, these different institutions will work together to drive up the price.
Therefore, as retail investors, knowing the principles of institutional trading allows us to identify these positions in advance and genuinely go long while 'waiting for the rabbit, taking advantage of the situation', making money alongside the institutions.
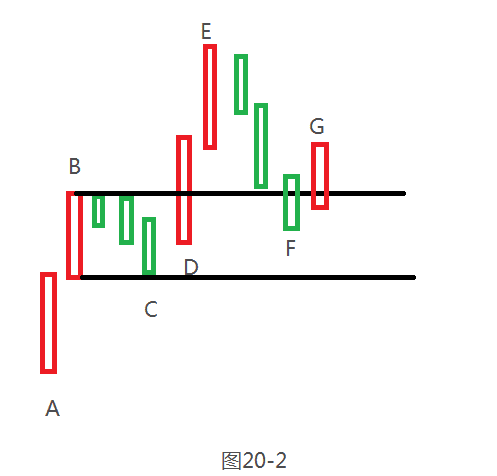
As shown in Figure 20-2: When the price falls back from E to the BC range, F is the entry point we focus on, G is the confirmation for the entry, and the stop-loss is below the bottom of C, while the top of E is the first target. Figures 20-1 and 20-2 define the institutions' demand area, while the definition of the institutions' supply area is the mirror of the institutions' demand area.
Let's look at the real case below:
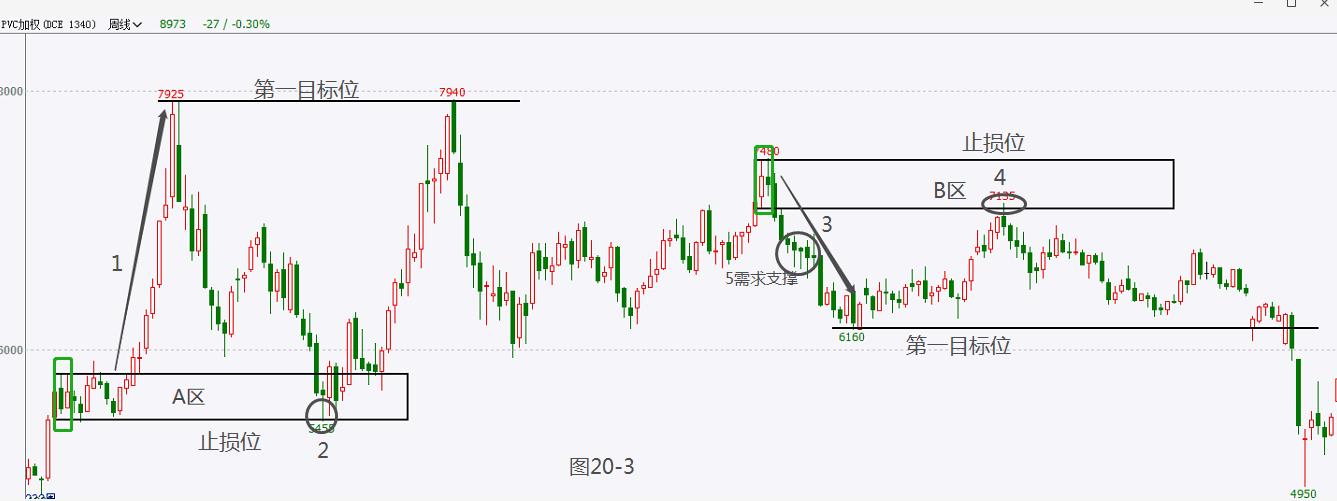
As shown in Figure 20-3, zone A is an important demand area. The rise in wave 1 is a long bullish candle with three highs and no long upper or lower shadows (shadows represent high and low selling of supply), quickly leaving the demand area, reflecting the institutions' willingness to rise and their control power. When the price quickly returns to zone A, the PINBAR (hammer) shown in 2 is a good buying point, with a stop-loss below the bottom of zone A, and the first target is at the top of the wave 1 rise.
Zone B is an important supply area. The drop in wave 3 quickly left the supply area, but during the subsequent drop, the candle shown in 5 indicated four consecutive candles with long lower shadows and one long upper shadow, reflecting the demand for bottom fishing and chasing highs. Here, demand consumed some supply, indicating that the institutions' control over short positions is not strong. After the price of candle 4 pierced through zone B, it began to decline in three lower waves, but the entire drop was not smooth. The stop-loss point is above the top of zone B. The bottom of the drop in wave 3 is the first target.
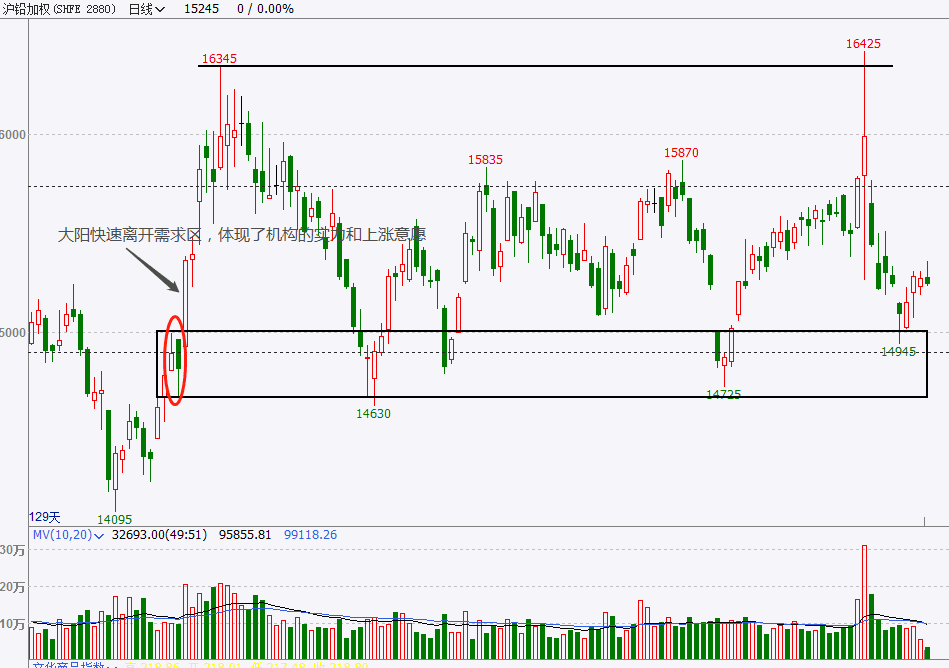
Figure 20-4
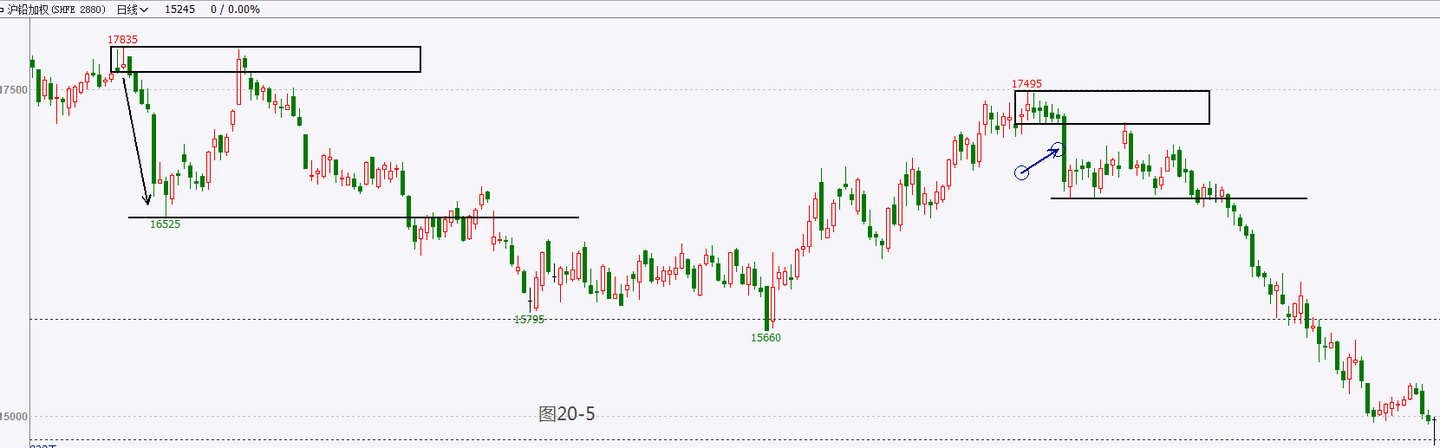
Can you, as a smart person, use the knowledge points I shared to analyze the principles of institutional manipulation of prices in the demand and supply areas in Figures 20-4 and 20-5? Now, considering 'reverse thinking', what does it indicate about the essence of the market when the demand and supply areas are broken?
A single tree cannot make a forest, and a lonely sail cannot sail far! In this circle, if you do not have a good circle and no first-hand news from the crypto world, then I suggest you follow Old Wang, who will help you get on board for free. Welcome to join the team!!!
