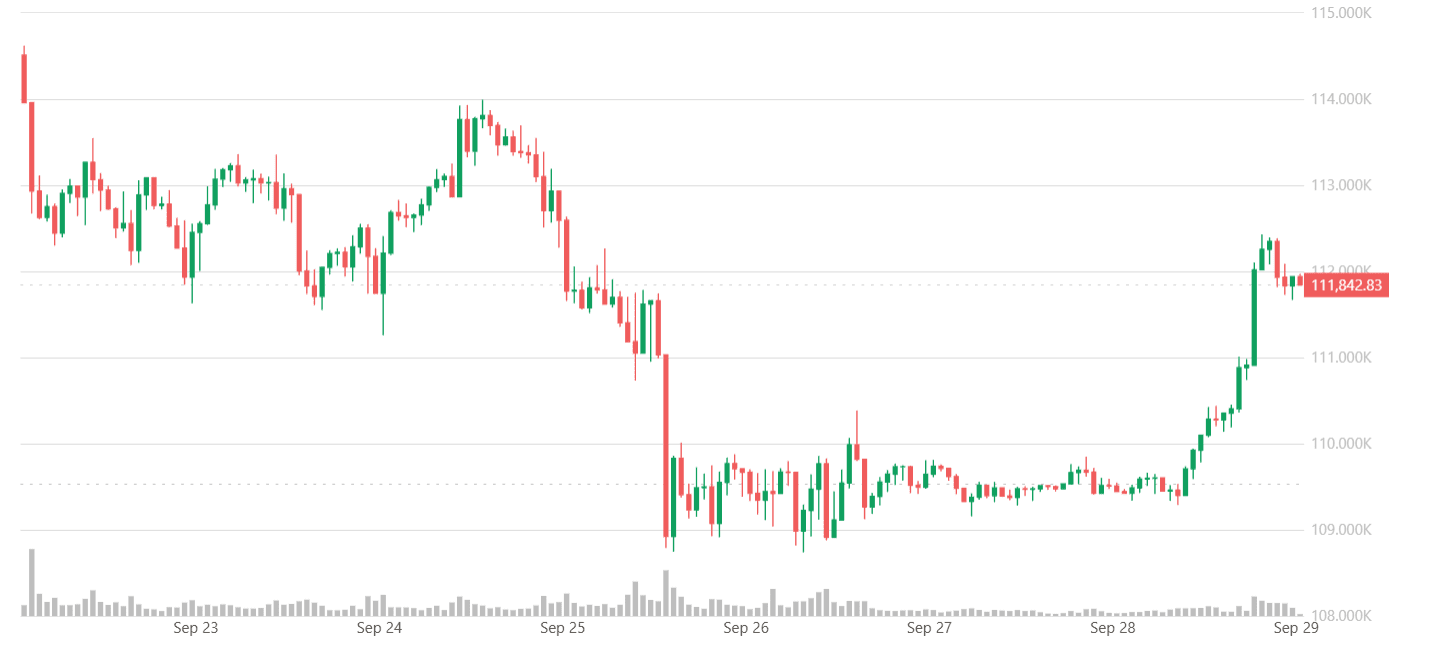
On Monday (September 29), during the Asian market session, Bitcoin broke the low consolidation pattern of the past day and is currently climbing above $111,800. Last week, due to profit-taking and portfolio rebalancing, the spot ETF shifted to a net outflow. Next, we will focus on the expiration of over $22 billion in crypto options at the end of the third quarter, while also paying attention to further signals from the Federal Reserve's policy.
The U.S. spot Bitcoin exchange-traded fund turned net outflow last week, ending four consecutive weeks of inflows, coinciding with the end of the third quarter of this year. According to SoSoValue data, the net outflow last week was $902.5 million, the lowest level in over 30 days, mainly due to the outflow of $418.25 million on Friday.
Fidelity's FBTC product experienced the largest outflow last Friday, reaching $300.41 million, followed by BlackRock's IBIT outflow of $37.25 million.
Shawn Young, chief analyst at MEXC Research, stated that this is mainly "due to profit-taking and portfolio rebalancing, especially as the quarter-end approaches."
Despite this, Young believes Bitcoin still has upside potential, noting that these products "are actively traded as part of mainstream portfolio management. The long-term trend adopted by institutions remains unchanged."
With the expiration of quarterly options coinciding with the release of significant inflation data in the U.S., cryptocurrencies face a critical test this week, a convergence that may determine whether Bitcoin's rebound can gain momentum or stagnate. According to data from the options exchange Deribit, about $22.3 billion in crypto options will expire at the end of the third quarter, including $1.706 billion in Bitcoin options.
Interest rate cuts and options expirations put Bitcoin at a crossroads.
Bitcoin is struggling to regain the momentum it had in mid-August when the asset reached an all-time high of over $124,000.
Despite Bitcoin's drop to $108,600 last week, the return in September remains positive at about 3.2%. According to CoinGecko, Bitcoin saw a slight rebound that day, rising over 2% to $111,800.
Young stated that the seller's lack of follow-up indicates that the market exhibits resilience under pressure, emphasizing that Bitcoin is currently in a consolidation phase rather than a weak position.
What will happen to Bitcoin next?
Bitcoin is currently in a macro tug-of-war as the Federal Reserve's moderately dovish stance strengthens the dollar while gold has pulled back after hitting a record high on Wednesday. These conflicting signals have caused Bitcoin to oscillate within a narrow range, lagging far behind the record momentum of stocks and gold. The Federal Reserve's 25 basis point "insurance rate cut" last week effectively stabilized short-term rates, but also triggered a sell-off in long-term Treasuries, pushing yields higher.
Young said, "The market is essentially waiting for clearer macro signals, which may come from the Federal Reserve, U.S. government policies, or liquidity trends, before making the next decision."
As Bitcoin has typically gained over 50% returns in the fourth quarter of past bull markets, market sentiment remains optimistic.
Young expects, "Higher volatility will emerge in the coming months" and "possible trend movements," which will manifest as new momentum and provide investors with opportunities to build new positions on existing holdings.
However, analyst Jordi Biseo indicated that Bitcoin (BTC) is expected to undergo several adjustments of around 20% on its way to new historical highs.
Jordi Biseo stated, "Leading stock company NVIDIA saw its stock price increase tenfold in less than three years after the release of ChatGPT, but experienced five adjustments of over 20% during that time," adding, "Bitcoin may exhibit the same trend."
Biseo explained, "The expansion of artificial intelligence (AI) may undermine the value of traditional companies, thereby driving funds into Bitcoin."
Bitcoin Technical Analysis
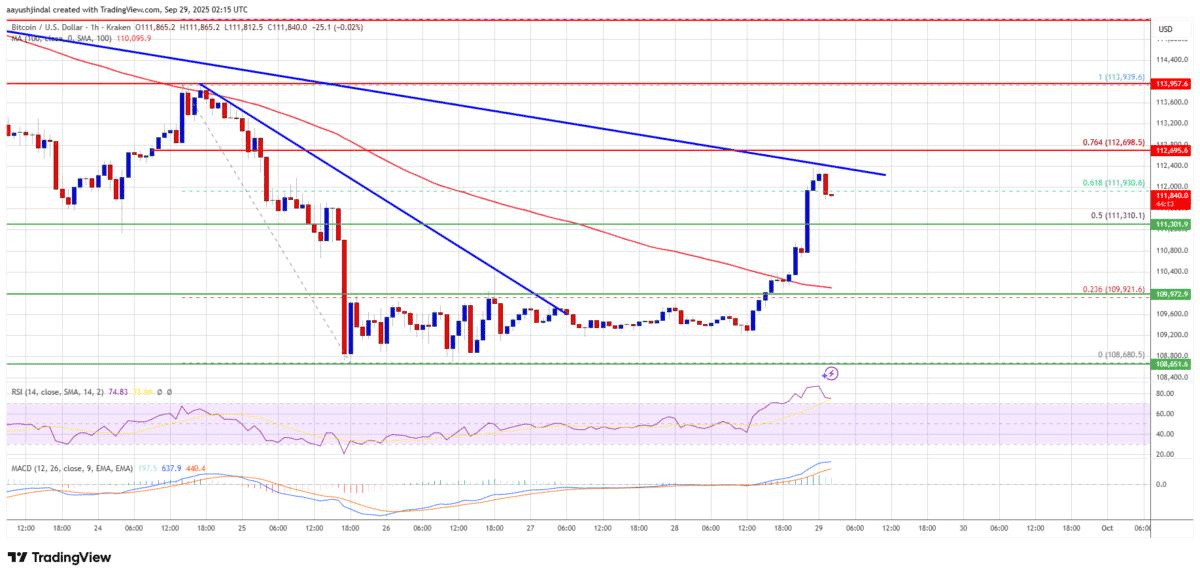
Bitcoin's price successfully maintained above the 108,500 range and began a rebound. BTC broke through the resistance zone at 109,500, initiating the current upward trend. Bitcoin's price clearly surpassed the 50% Fibonacci retracement from the fluctuation high of 113,940 to the low of 108,680. Additionally, a resistance line connecting downward trends on the BTC/USD hourly chart at 109,600 was also broken. Bulls even pushed the price above 112,000 before bears emerged. Bitcoin is currently trading above 111,500 and is above the 100-hour moving average.
On the upside, immediate resistance is close to 112,400. The first key resistance is near 112,500, with another trend line also at this point. The next resistance could be 113,700, or the 76.4% Fibonacci retracement from the fluctuation high of 113,940 to the low of 108,680. If the price can break through the resistance at 112,700, it may rise further. In this case, the price could rise and test the resistance at 113,500. Any further increases could push the price close to 114,500. The next hurdle for the bulls may be 115,000.
Conversely, if Bitcoin fails to break through the resistance zone at 112,500, it may begin a new decline. Immediate support is located around 111,300. The first major support level is around 110,500. The next support level is now in the 109,500 range. Any further declines could push the price towards the short-term support level of 108,800. Major support is at 107,500; if this level is broken, Bitcoin may struggle to recover in the short term.
Technical Indicators:
Hourly MACD – MACD is currently accelerating within a bullish range.
Hourly RSI – RSI is currently above the 50 level.
Major support levels – 111,300, followed by 110,500.
Major resistance levels – 112,500, followed by 112,700.


