according to the materials from the site - By CFU

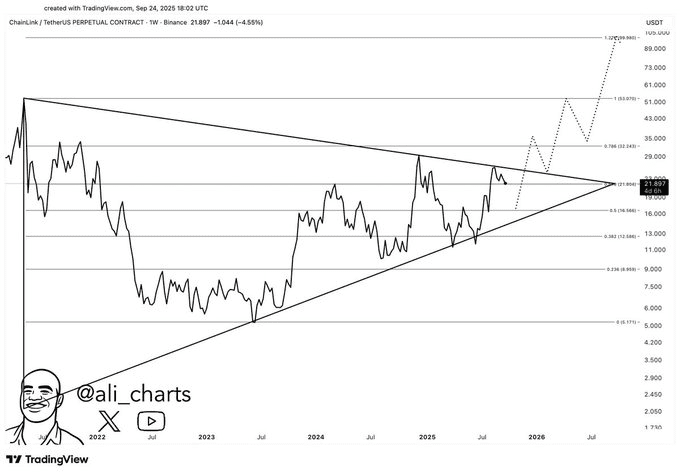
Chainlink ($LINK) is approaching the peak of a multi-year symmetrical triangle. Analysts consider $16 a potential accumulation zone before a breakout that could reach $100 in the long term.
On the weekly chart, Chainlink shows a multi-year symmetrical pattern that has been compressing price dynamics since 2021. Such patterns reflect prolonged phases of consolidation that often precede decisive movements in either direction. At the time of writing, LINK is trading around $20.05, recording a daily decline of 3.76% and a drop of 17.98% over the past seven days. Market analyst Ali (@ali_charts) describes the drop to $16 as a 'gift', pointing to this level as an upward base of the structure. It also coincides with the Fibonacci retracement level of 0.382, making it a strong technical area with potential for accumulation. A pullback to this level could wash out speculative positions and prepare the market for a resumption of upward momentum.
Fibonacci extensions based on previous fluctuations predict potential growth targets of $35, $52, $73, and $100. The key battleground is the immediate resistance zone between $25 and $28. Passing through it will confirm a bullish trend aimed at reaching the suggested targets.
Market positioning reveals a strong long-term bias and short-term volatility
Market positioning in derivatives provides a deeper understanding of trader sentiment. On Binance, the long to short position ratio for LINK/USDT is 2.6049, while on OKX it is 2.22, reflecting a strong bullish bias. Among leading traders, the metrics are even higher: on Binance, the ratio for accounts and positions is 2.9032 and 3.0246, respectively.
Such a high concentration of long positions indicates confidence but also increases the risk of cascading liquidations. The total volume of liquidations over the last 24 hours amounted to $5.08 million, of which long positions accounted for $4.70 million and short positions for $378.95 thousand. This means that the recent volatility has disproportionately hit traders who were bullish.
Smaller liquidation windows highlight opposing forces. Liquidations within the hour were slightly higher than shorts, but long positions incurred greater losses over four and twelve hours. The overall picture is that the market is shedding excess leverage while maintaining its structural bullish trend.
Strategic forecast and key price levels for Chainlink traders
Support at the $16 level is another important support level to watch. It is the foundation of a long-term triangle and a Fibonacci retracement area, making it a reasonable point for development based on disciplined accumulation. A long-term drop below this level could lead to a temporary weakening of the structure along line 12.
On the other hand, the resistance range of $25-$28 poses a short-term obstacle for LINK. A confident breakthrough of this area would likely act as a catalyst for momentum toward subsequent Fibonacci levels of $35 and $52, with longer-term targets of $73 and $100.
Volatility will increase as the market approaches the peak of a multi-year structure. The long to short position ratio has a strong bullish sentiment, so traders should be cautious of accumulation risk. Risk management and monitoring order flow around these important levels will be crucial as Chainlink prepares for the next significant phase.
#MarketRebound , #Сryptomarketnews
If you can't handle a large flow of news related to cryptocurrencies and the financial world, then maybe you shouldn't be subscribed to this group (!) ... 😉🙄


