The essence of market trading
Lesson Eighteen
In today's lesson, I want to explain how to find important support and resistance areas according to my system. Support and resistance are not just a line but a region, please keep this in mind.
Before the lecture, I will first summarize and review my definition of multiple candlesticks:
Trend candlestick: A, bullish same direction three high pattern; B, bearish same direction three low pattern.
Reversal candlestick: C, opposite three high pattern; D, opposite three low pattern.
Pause candlestick: non-trend non-reversal candlestick form (non-directional form).
Today's focus is on the third form, which is the pause form.
The pause pattern can be said to be the most important pattern, as it is the breeding ground for trend patterns. It may be the main accumulation area for bullish trends or the main accumulation area for bearish trends. A large number of main orders are accumulated inside. When the price breaks through this pause interval and returns here, due to the unfilled orders inside the interval, the main force pushes the price to continue moving in the direction of the breakthrough.
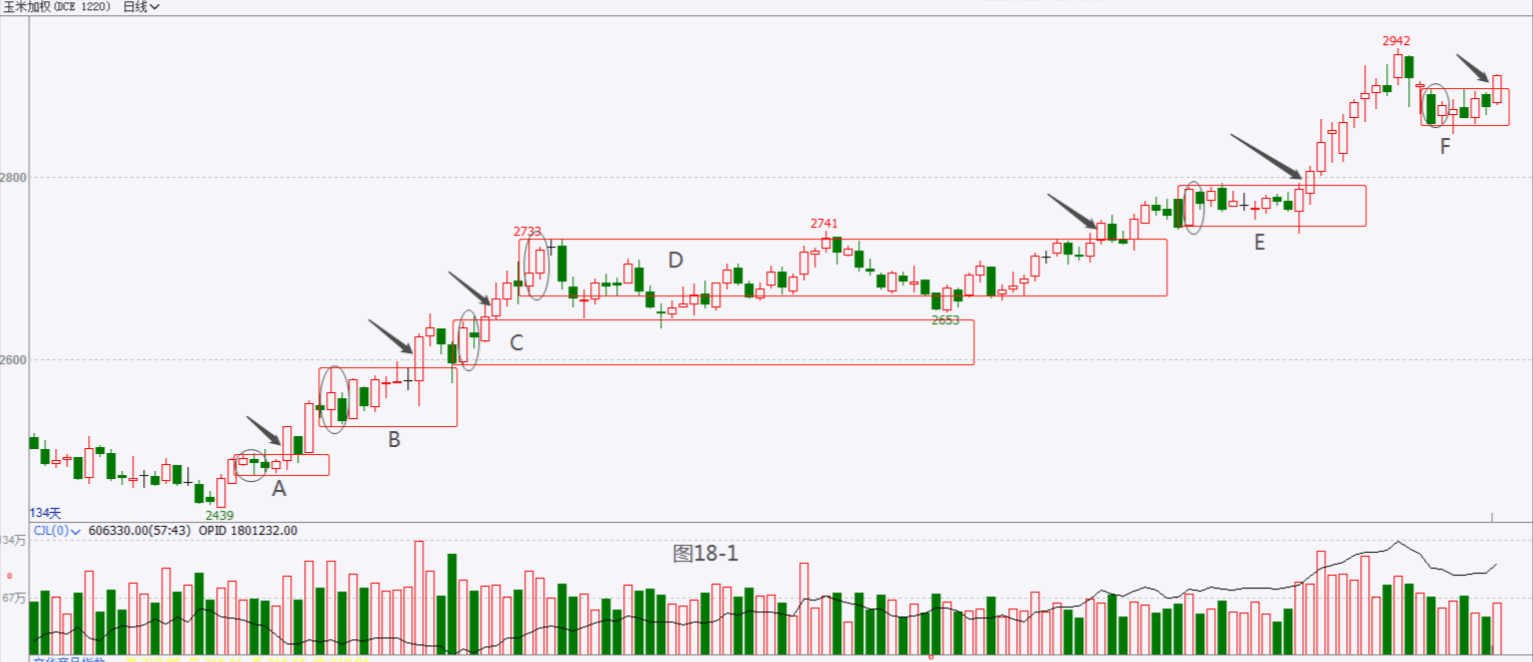
As shown in Figure 18-1, the circles represent the first combination of pauses, and the red boxes are the clusters of pause candles, which are areas of high trading volume. From the subsequent breakthroughs indicated by the black arrows, it can be confirmed that a large number of bullish positions are accumulating in these areas.
If you are careful, you will find that after the price breaks through, a pullback occurs. According to my trading system: the principle of 'breakthrough + pullback' entry, the pullback points are all good entry points, avoiding the risk of chasing highs.
We can see that these red boxes are being raised in a stepwise manner, indicating that the main force is continuously washing out and absorbing within the boxes. The cost price for both the main force and retail investors has been raised, and from a profit perspective, the main force must have enough safety space to distribute safely and smoothly.
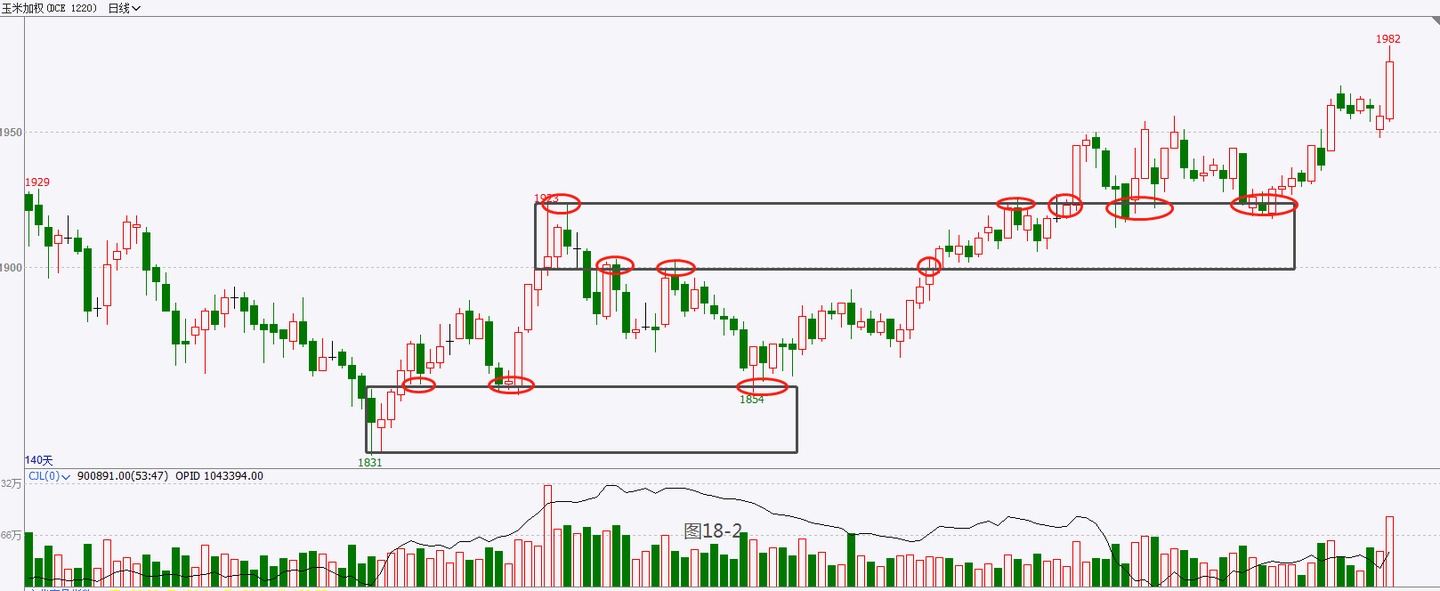
As shown in Figure 18-2, the tops and bottoms of the pause candles play an important role in supporting resistance. These points are important reference points in my real trading operations.
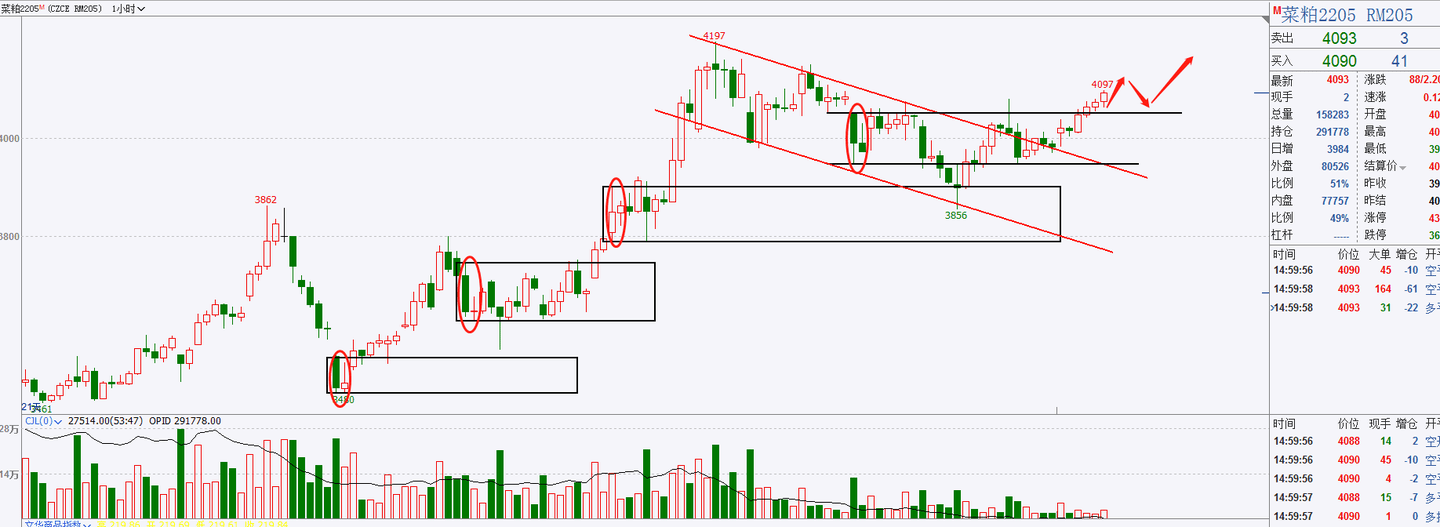
Figure 18-2
As shown in Figure 18-3, the circles are the key candle groups that define the pause interval. These intervals provide excellent support and resistance. When the price pulls back to these intervals and a stop-loss PINBAR (hammer) appears, it is a great entry point.
A single tree cannot make a forest, and a lone sail cannot travel far! In the circle, if you do not have a good circle, nor the latest information from the cryptocurrency world, then I suggest you follow Old Wang, who will guide you to profit without cost, and welcome you to join the team!!!