The Essence of Market Trading
Second Lesson
Before discussing the content of the second lesson, let’s recall the content of the first lesson:
The three key points of a single candlestick: High = Resistance Level / Lowest = Support Level / Closing Price = Outcome.
Two Candlestick Combination Patterns:
Trend Pattern: Three Highs / Three Lows
Pause Pattern: Pregnant Line / Piercing
Reversal Pattern: / Engulfing
Today’s theme is to combine the knowledge from the first lesson to conduct price action analysis of multiple candlesticks (Naked K analysis). First, I casually captured a recent daily chart of the glass-weighted index as learning material. As shown in the figure:
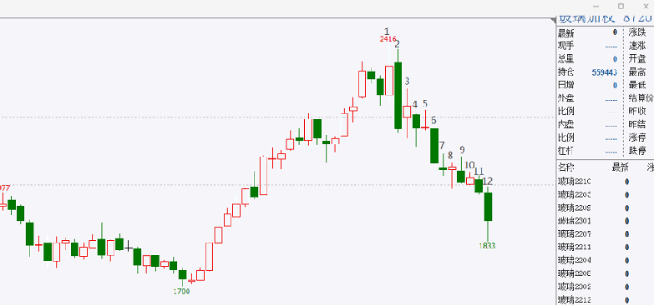
Figure 2-1
Candle 1 is a solid bullish line with an upward direction. Its highest price is a resistance level, the lowest price is a support level, and the closing price equals the highest price, indicating the bulls' success.
Candle 2 breaks below the support level of 1, forming a bearish engulfing pattern with candle 1, the trend direction is downward;
Candle 3, compared to candle 2, has lower highs and lower lows, but the closing price is higher, forming an upward penetration pattern, indicating a pause in the downward trend. We need to closely monitor the price flow direction of the next candle. If the next closing forms three highs with the third candle, we will be bullish; if it forms three lows, we will be bearish.
Candle 4 continues to decline, forming a three low pattern with candle 3, we remain bearish;
Candle 5, compared to candle 4, has higher highs, higher lows, and a closing price slightly higher than that of 4, similar to three highs being bullish. However, its own closing price is at a low position, which is a bearish candle, thus creating conflicting signals. We treat it as a pause signal and need to closely monitor the price flow direction of the next candle.
Candle 6 breaks the lowest price of 4 and 5, forming three lows, continue to be bearish;
Candle 7 itself closing at the bottom is a bearish candle, and candle 6 forms three lows, continue to be bearish;
Candle 8 itself closed at a high position, which is a bullish candle (drawing our attention). Compared to candle 7, it has lower highs and lower lows, but the closing price is slightly higher than that of 7 (the bearish result of 7 is not significant). The two candles combine to form a pause pattern: an upward penetration, with two conflicting signals, so closely monitor the price flow direction of the next candle.
Candle 9 itself is a bearish candle closing at the bottom. Compared to candle 8, it has higher highs and higher lows, but the closing price is lower than that of 8, indicating that the bulls' achievements of candle 8 have not been maintained. This is a pause pattern: downward penetration. Therefore, combined signals lean towards bearish.
Candle 10 is a low amplitude small bullish candle, with not much rebound strength. Compared to candle 9, it has lower highs and lower lows, but the closing price is higher than that of 9, which is a pause pattern: penetration. Considering the two signals, the trend is bearish.
Candle 11 is three lows and closes at the bottom, continue to be bearish.
Candle 12 is three lows, the long bearish candle closes near the midpoint, indicating demand for entry or short covering. Continue to be bearish.
Everyone follows my thinking; you can experience the price flow and understand the trend direction of the price.
Too much information in one lesson is not conducive to digestion; learning is a continuous process. In the upcoming lessons, I will continue to explain the game of supply and demand through the relative positional relationship between candles.
One tree cannot make a forest, a lonely sail cannot travel far! In the cryptocurrency circle, if you do not have a good circle, and lack firsthand news from the crypto world, then I suggest you pay attention to Old Wang, who will help you make a profit. You are welcome to join the team!!!
