ADA is trading around $0.77–$0.80 USD levels.
The past week has seen a pullback, with the token down ~15-20% from recent highs.
Technicals show a mix of caution and potential setups for a bounce.
So, is ADA bullish or bearish right now? The answer is: it depends on how price interacts with key levels. Let’s break it down.
---
✅ Bullish Case
Here’s what supports a more optimistic view:
1. Double Bottom / Demand Zone Support
ADA has held a demand/support zone near $0.7682 on multiple attempts.
This zone acts as a base where buyers have stepped in, making it a critical defense point.
2. Higher Lows & Reversal Potential
Price is showing hints of forming higher lows within recent consolidation zones, which could set the stage for a reversal.
A break above resistance could validate this shift in structure.
3. Foundation & Liquidity Backing
The Cardano Foundation has committed a multi-million ADA allocation to boost liquidity (especially in the stablecoin / DeFi side) to strengthen ecosystem growth.
Better liquidity and deeper DEX / on-chain markets can reduce slippage and support upward moves.
4. Upside Target if Resistance Broken
If ADA can break above the key resistance at $0.9614, analysts point to a possible rally toward $1.20 (roughly +50%) as a next leg.
Intermediate resistances (e.g. $0.95, $1.00) are in the path.
---
⚠️ Bearish / Caution Case
Here are the risks and weaker-side scenarios:
1. Failure to Hold Support
If ADA breaks below $0.7682 decisively, the bullish structure is invalidated.
The next likely downside zone could be in the $0.60–$0.70 range.
2. Resistance Rejections / Supply Zones
There’s stiff overhead resistance around $0.90 – $0.96. Multiple rejections here would signal strong seller presence.
Also shorter-term resistance zones near $0.81–$0.85 are being tested now.
3. Bearish Indicators & Momentum
Some moving averages are above current price, acting as dynamic resistance.
Technical oscillators are weak or neutral, meaning momentum could lean toward downside in absence of strong catalysts.
4. Liquidity Vacuum / Thin Areas
If price enters zones without much prior trading (low liquidity), it could “gap” down quickly.
In a panic or high-volatility move, stops below support could accelerate downside.
---
📊 Key Levels & Liquidity Zones
Level Type Notes / Significance
~$0.7682 Major Support / Demand Zone Critical base to defend bullish thesis.
~$0.72–$0.70 Secondary Support Zone If main support breaks, this range may act as fallback.
~$0.81–$0.85 Near-Term Resistance / Supply Price is battling here now.
~$0.90–$0.96 Major Resistance / Liquidity Rack A breakout above here is key for strong upside.
~$1.20 Target / Extended Resistance If momentum is strong, this is a possible longer-term aim.
---
🧭 Verdict & Post Suggestion
At the moment, ADA is in a neutral-to-slightly-bullish zone, but the path forward is narrow. The market is at a tipping point:
If ADA holds $0.7682 and breaks past $0.90–$0.96, we may see a strong bullish leg.
But if support fails, a downside move toward $0.60–$0.70 becomes plausible.
Here’s a possible post text you can drop:
---
🔍 ADA (Cardano) — Bullish or Bearish? Let’s break it down:
🛡 Support to watch: $0.7682 is the main defense zone. If ADA holds this, it keeps the bullish case alive.
🚧 Resistance walls: Strong supply around $0.90–$0.96 — clearing this is key.
📈 Bull case: A break above $0.96 could lead to ~50% upside toward $1.20.
⚠ Bear case: If $0.7682 cracks, ADA could slide into $0.60–$0.70 range.
💧 Liquidity boost: The Foundation’s ADA injections into stablecoin / DeFi liquidity are positives for depth.
🔎 Watch price action: A valid breakout or breakdown from the current congestion will likely set the next major trend.
Stay 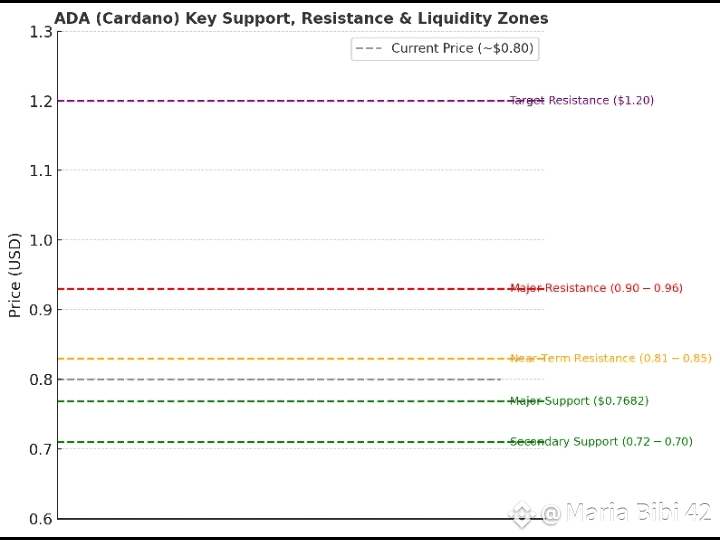 tuned — ADA is gearing for a directional move. Always use stop losses and
manage risk. DYOR! 🧠
