
Written by: Frank, PANews
In the autumn of 2025, the competitive landscape of public chains is changing dramatically, with an escalating offensive and defensive battle surrounding users, capital, and ecosystem activity. The former king, Solana, is once again facing a challenge of declining traffic, while BNB Chain has launched a strong 'siphoning effect' with its powerful new ecosystem and technological upgrades. Meanwhile, Ethereum's mainnet is steadily growing amid the noise, and the Layer 2 track presents a complex scenario of both ice and fire.
PANews will conduct an in-depth analysis of the latest data from major public chains, revealing the underlying motivations and future trends behind this migration of traffic.
Solana: Facing challenges of capital outflow as multiple data indicators decline.
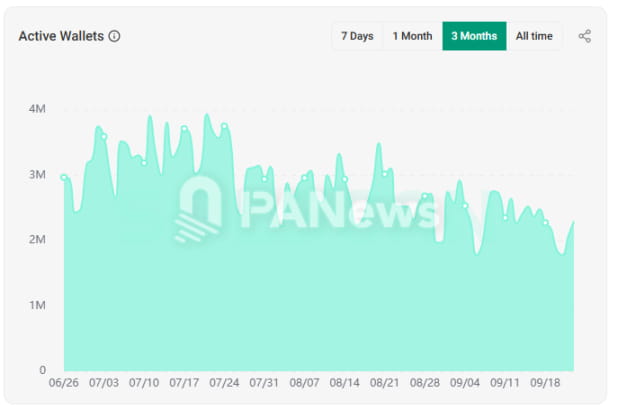
Solana's data performance has shown a downward trend in the past three months, losing its leading position in several metrics. The decline is most apparent in the number of active addresses and the issuance of new tokens. As of September 24, the number of active wallets on the Solana network was 2.19 million, down 63.5% compared to 6 million in June. This level of data is even lower than the activity before August 2024, and this decline is not an isolated phenomenon. Currently, the number of new tokens is around 31,000, a significant drop compared to the peak of over 80,000 created daily in January. This drop has mainly occurred recently; on September 15, the daily new token data still maintained around 50,000.
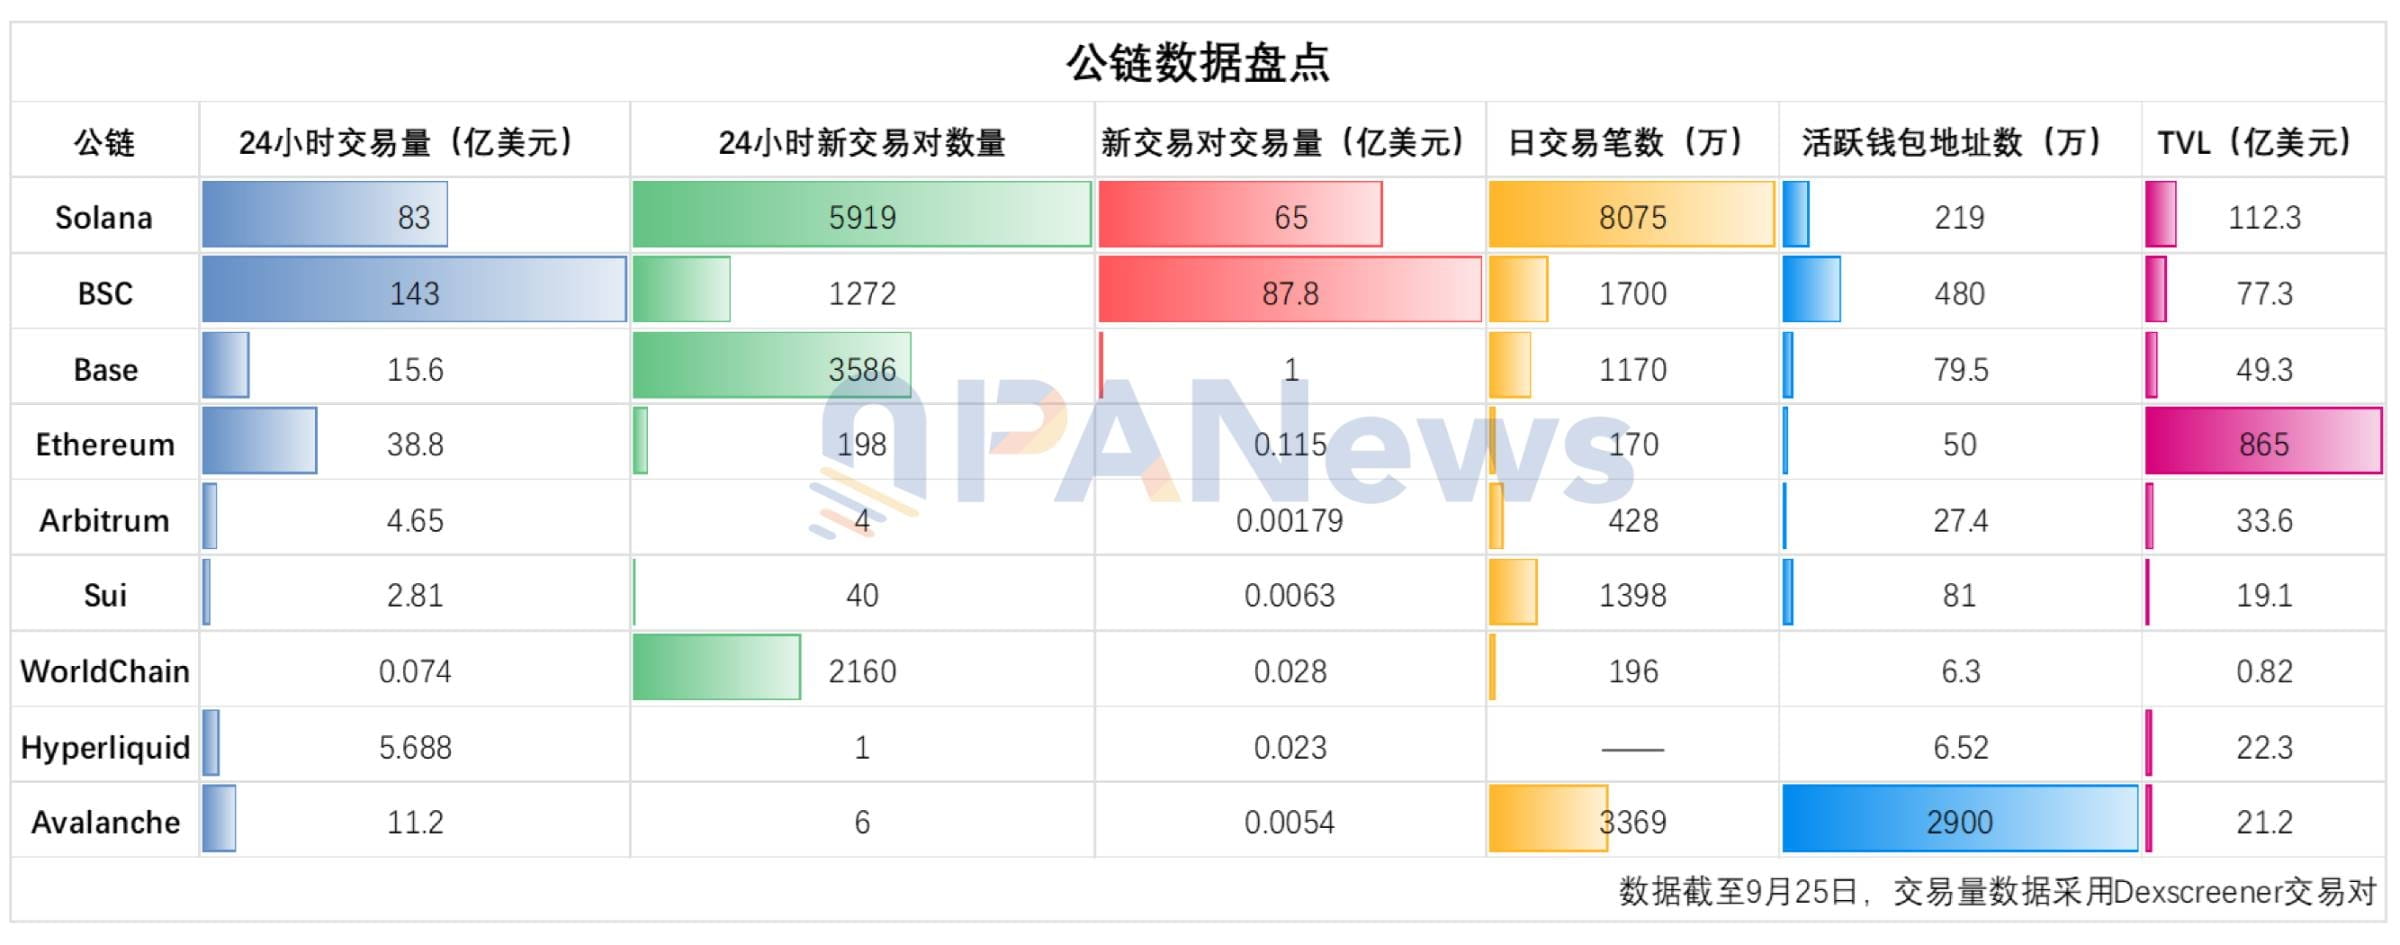
In terms of trading volume on DEX, according to Dexscreene's data, in the most recent 24 hours, BSC's on-chain trading volume was about $14.3 billion, while Solana's trading volume was around $8.3 billion. Solana is no longer the most active public chain for trading. However, the number of new trading pairs recently created on Solana in the last 24 hours is still 5,919, keeping it in the first position.
In terms of funds, Solana's capital outflow has also been quite evident in the past week, with a net outflow of approximately $63.4 million.
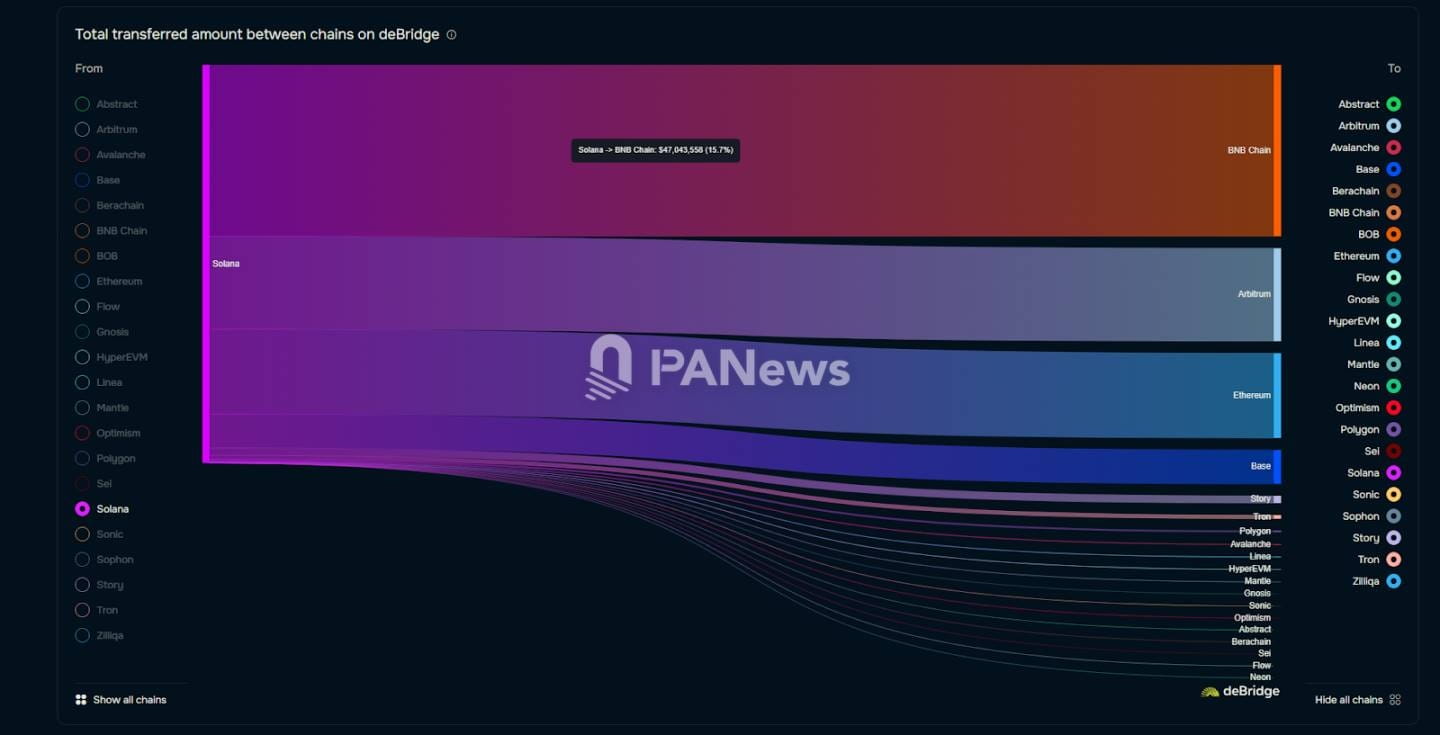
In terms of outflow, according to data from deBridge, the BSC chain has become the main direction for Solana's capital outflow. In the past week, approximately $47 million flowed from Solana to BSC, while only $28 million flowed back from BSC. From this perspective, BSC is indeed siphoning off traffic from Solana. Although Solana is facing positive factors in the capital market such as ETFs and several DAT companies, and has just passed the latest Alpenglow upgrade plan in September, these have not boosted the on-chain ecosystem's activity.
BSC: Strong rise, traffic surge aimed at Solana's king status.
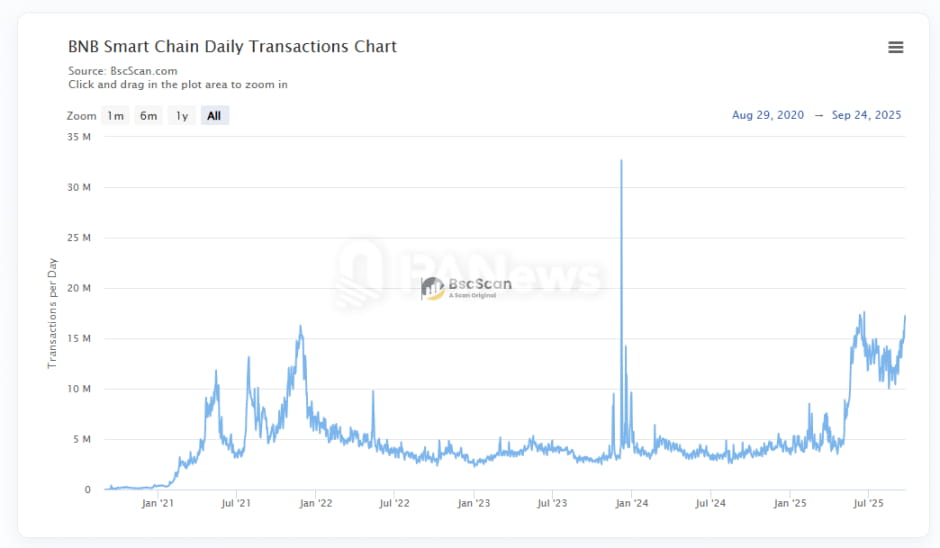
BNB Chain has been on the rise in recent months and is poised to surpass Solana. First, as of September 25, the daily active address count for BSC is about 4.8 million, surpassing Solana's 2.19 million. In April, this figure was only 2.6 million, an increase of about 84.6%. Additionally, in terms of daily transaction volume, there has also been a significant increase recently, with current data around 17 million daily transactions. On August 30, this figure was only about 10 million, indicating an increase of approximately 70% over the past month. Compared to the average daily transaction volume of 3 million at the beginning of the year, this represents nearly a sixfold growth.
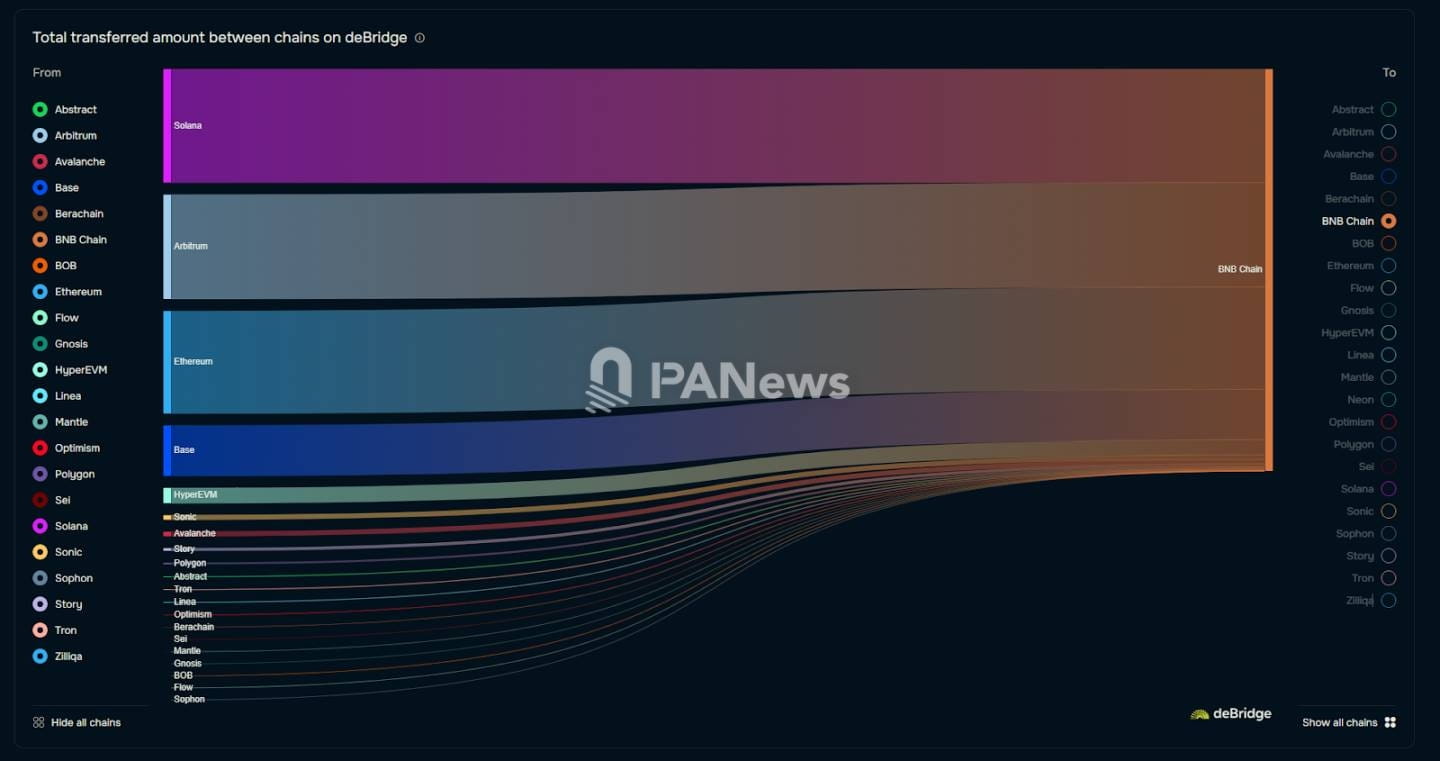
In terms of capital flow, in the past week, BSC's net inflow of funds was about $73.5 million, making it the third-ranked public chain in terms of inflow. According to data from deBridge, the inflow mainly came from Solana, Arbitrum, and the Ethereum mainnet.
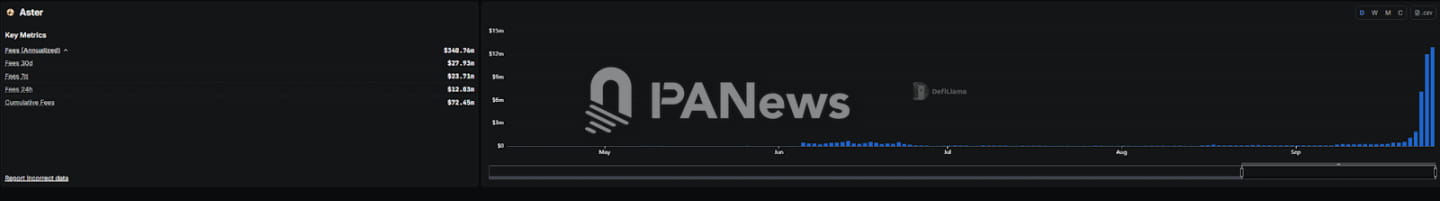
The reasons behind these changes stem partly from the wealth effect attracted from Alpha some time ago and the recent popularity of Aster. On September 25, Aster's daily fees reached an astonishing $12.92 million, second only to Tether. The contract trading volume reached $35.8 billion, already surpassing Hyperliquid.
On September 23, BNB Chain disclosed on the X platform that validators are proposing to lower the minimum Gas price of the BNB Smart Chain from 0.1 Gwei to 0.05 Gwei, while accelerating the block interval from 750 milliseconds to 450 milliseconds to maintain competitiveness with the fastest blockchains in the cryptocurrency field. Once this upgrade is completed, BSC will nearly match Solana in performance. Clearly, this offensive by the BSC chain against Solana is no longer as simple as the previous launch of the Four.me meme offensive.
Ethereum: Stable growth amidst the noise.
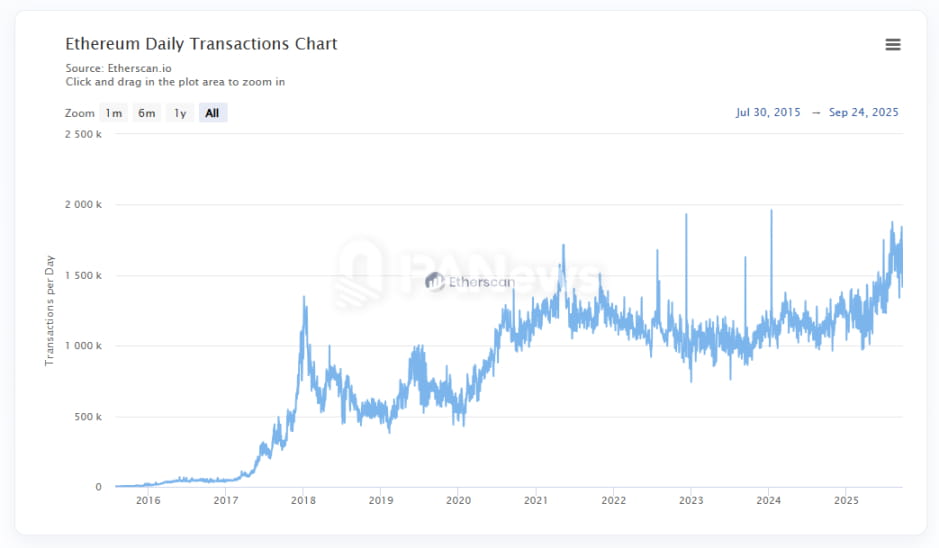
Although Ethereum's mainnet dynamics are not currently very apparent, there has been a noticeable improvement in data. For example, in terms of daily transaction volume, throughout 2024, Ethereum's network daily transaction volume has largely maintained around 1 million. After April 2025, this figure began to rise significantly and currently hovers between 1.5 million and 1.8 million, representing the highest levels in Ethereum's history.
In terms of daily active users, a similar situation has also emerged. In August, Ethereum's daily active users peaked at 557,200, marking the highest level in nearly three years. Moreover, this increase is no longer a fleeting moment but has been sustained over a period of time. As of September 22, its daily active data still remains above 500,000.
Of course, as a public chain primarily focused on DeFi and infrastructure, the rise in Ethereum's mainnet activity does not seem to be driven by new projects. For example, on September 25, the number of new trading pools created on the Ethereum mainnet was 198, with a trading volume of around $11.5 million, accounting for only 0.3% of the day's on-chain trading volume of $3.88 billion.
Another major data change for Ethereum is TVL. Starting from April 2025, Ethereum's TVL soared from $45 billion to a peak of $97 billion. However, the main reason behind this data increase may still be attributed to the rise in ETH prices. From the amount of staked ETH, this data has been declining since April, indicating a decrease in the amount of ETH staked on the Ethereum chain. Therefore, the new TVL may come from other sources. This new value may stem from the growth of stablecoins; as of September 25, the market capitalization of stablecoin issuance on Ethereum reached $161.7 billion, nearly double the data of $84 billion from December last year.
Base: Transactions remain active, but user loss rings alarm bells.
The on-chain transactions of the Base chain remain relatively active. In terms of daily transaction volume, it can be seen that from around 8.4 million daily transactions in August, it increased significantly to 14.48 million by September 21, setting a historical high, surpassing the peak data from January. Additionally, the number of new tokens created also shows activity, with Dexscreene reporting 3,586 new trading pools created in the last 24 hours, even higher than the BSC chain.
However, in terms of daily active data, Base has shown a clear downward trend since July, dropping from a peak of 2.4 million daily active users to 797,000 on September 22, a decline of 67%. Additionally, in the past week, Base's net outflow of funds reached $99.6 million, making it one of the public chains with the highest net outflow.
Overall, Base remains the most active public chain among Ethereum L2s. Even though there has been a decline in daily active data, it still holds advantages in various metrics.
Arbitrum: The leading position of L2 faces challenges.
Arbitrum still maintains its leading position in terms of TVL and stablecoin data among Ethereum L2s, but the daily transaction volume of Arbitrum is quite volatile. On September 22, Arbitrum's daily transaction volume reached 4.28 million, while the day before, this figure was 1.92 million. Such volatility is a microcosm of Arbitrum's transaction volume changes over the past year, which has consistently maintained this high volatility.
In terms of capital inflow, Arbitrum ranks first among all public chains, with a net inflow of $217 million in the past week. From the segmented sources of inflow, USDT0 and Hyperliquid still constitute a large portion of the inflow, indicating that Arbitrum currently plays a significant role as a funding bridge for Hyperliquid. However, with the launch of Hyperliquid's self-built stablecoin USDH, this tailwind effect may soon disappear.
Hyperliquid: Facing intense competitive pressure from emerging rivals.
From the perspective of public chains, Hyperliquid's data is not prominent. Its daily active users have seen significant growth, but only amount to 65,200. The weekly transaction volume is also only around 3 million. The TVL data has seen substantial growth this year, increasing from $1.9 billion in April to $6.1 billion.
From the DEX perspective, Hyperliquid has recently faced significant competitive pressure from Aster. Since August, there has been a clear downward trend in trading volume, dropping from the range of $10 billion to $20 billion down to the range of $5 billion to $10 billion.
Sui: Growth hits a bottleneck, is the emerging public chain entering a period of silence?
Sui's development seems to have entered a bottleneck period in 2025. The number of transactions has remained around 10 million since the beginning of 2025, with no apparent increase.
Although the number of active addresses is significantly higher than before March 2024, it has fluctuated between 500,000 and 1 million daily active users over the past year, with no clear upward or downward trend. In terms of TVL data, Sui has also seen a notable decline, dropping from $1.24 billion in July to $575 million now. The number of new trading pools created on-chain in 24 hours is only 40, far below the previously active MEME phase. It seems that Sui, which was once highly anticipated as an emerging public chain, is entering a period of silence.
Avalanche: On-chain activity has surged abnormally, and RWA may become a future focus.
Avalanche has finally experienced an explosion after being silent for several years. The most obvious indicator is the number of active addresses, which has surged from a few hundred thousand to several million since September, even reaching a historical record of 29 million on September 22. The number of transactions has also suddenly increased to the level of 50 million.
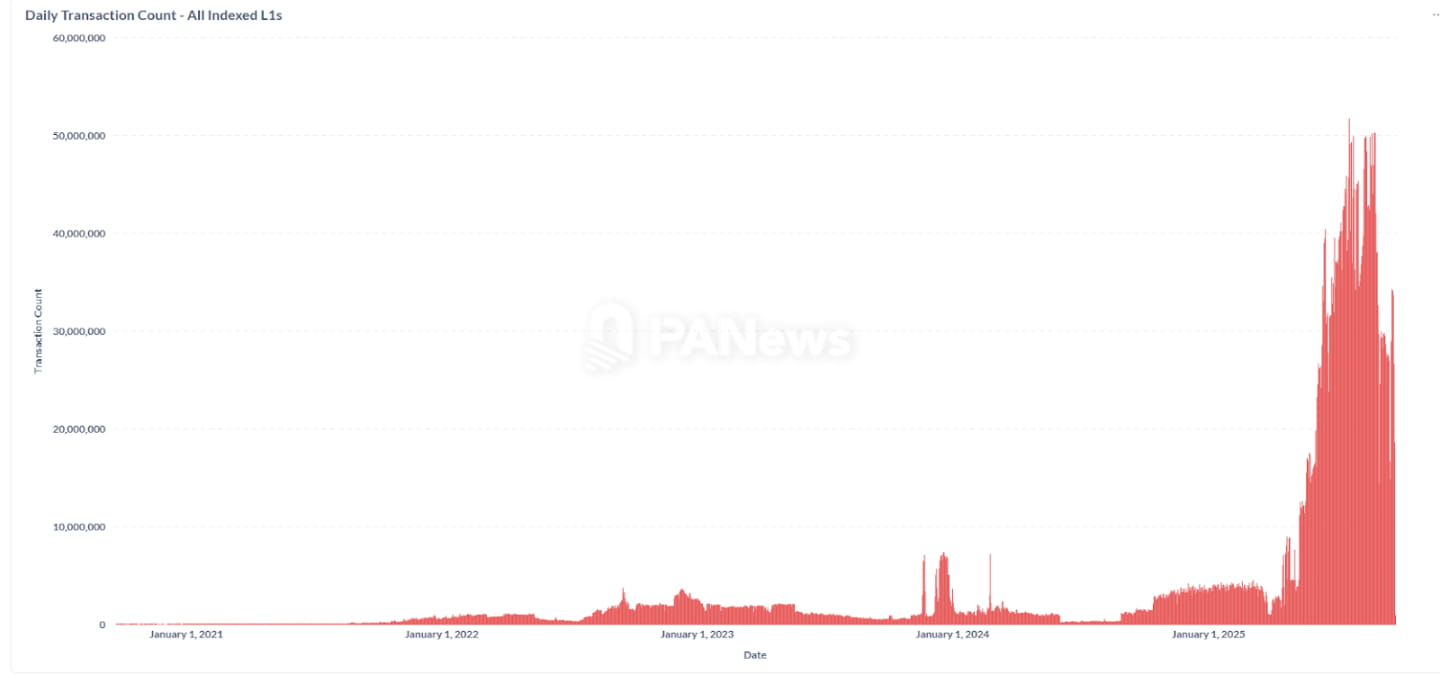
However, this surge seems to be not closely related to the activity of Avalanche (C-Chain). Looking at the data for C-Chain, the number of active addresses remains around 200,000. Although there has been some growth, the gap with the overall activity is still significant. PANews speculates that this abnormal increase in data may be related to a stress test conducted by a sub-network of Avalanche. In August, Grove Finance planned to allocate about $250 million in RWA on the Avalanche blockchain through Centrifuge and Janus Henderson.
On September 23, AgriFORCE announced its name change to AVAX One, planning to raise $550 million to become the first Nasdaq-listed company focused on acquiring Avalanche (AVAX) tokens. From the ecological perspective, Avalanche currently leans more towards developing RWA and stablecoins.
World Chain: The 'truth' behind huge capital inflows, team token migration.
World Chain is mentioned here because it ranked second in the recent week’s on-chain net inflow rankings, with a net inflow of $119 million. However, this inflow may not be driven by users but rather a strategic internal token migration by the Worldcoin team. On September 22, the Worldcoin team wallet transferred 110 million WLD from the Ethereum mainnet, of which 85 million (approximately $111 million) was cross-chain to World Chain.
Recent changes in data clearly show that competition in the public chain space has entered a new stage. The BSC chain, leveraging the wealth effect of phenomenal applications and ecosystem operations, has successfully captured a large amount of traffic and funds from Solana, staging a classic 'comeback'. Ethereum, relying on its strong network consensus and foundation, has demonstrated a 'ballast' stability in stablecoins and infrastructure.
At the same time, the internal competition of Layer 2 and the growth dilemma of emerging public chains tell us that this is a market driven by both technological iteration and narrative construction. The leading position of any public chain is not permanent; only through continuous innovation, building a prosperous developer ecosystem, and capturing the next market hotspot can one remain unbeaten in this never-ending battle for traffic. The future landscape remains full of uncertainties.