
The BNB currency is returning to a rising channel with the broader cryptocurrency market correction.
Derivatives data shows large capital flows, as indicated by open interest, suggesting a lower level of trader confidence.
Technical forecasts indicate that BNB is approaching a critical crossroads with declining buying pressure.
The currency (BNB) is trading at 944 dollars after a 7% drop the previous day. At the time of writing this report, BNB's losses extend by about 1% on Friday, approaching the support line of a rising channel. Both derivatives and technical forecasts indicate a sudden decline in buying pressure, highlighting the risks of additional corrections.
Selling dominance appears in BNB derivatives.
CoinGlass data indicates that the open interest for $BNB has decreased by 3.56% over the past 24 hours, now reaching $1.84 billion. These large capital flows from BNB derivatives suggest a cautious sentiment among traders.
In addition to reduced interest, the funding rate weighted by open interest fell to 0.0062% from 0.0091% earlier today. Furthermore, the liquidation of long positions worth $11.91 million in the past 24 hours outpaced the liquidation of short positions amounting to $721,610, indicating a larger cancellation of traders aligned with the upward trend.
Finally, the long-to-short ratio over 24 hours reads 0.9279, indicating that a larger number of short positions are active, suggesting selling dominance.
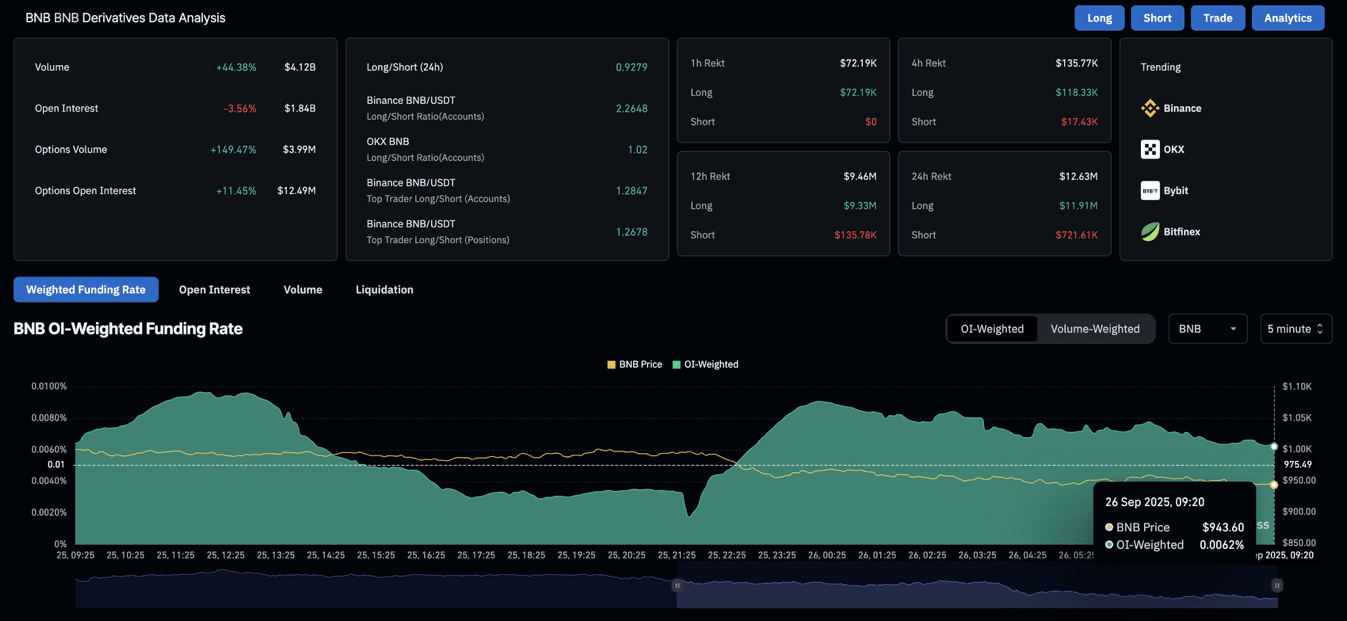
BNB derivatives. Source: CoinGlass
BNB faces the risk of channel collapse as buying pressure declines.
The $BNB is approaching the lower boundary of an ascending channel pattern on the daily chart. The CEX returned from the upper trend line at its all-time high of $1,083 on Sunday, igniting the current downward cycle within the parallel channel.
To confirm the channel collapse, bears in BNB must achieve a decisive close below the R1 pivot level, which acts as resistance turned support at $928. A potential bearish breakout could extend the decline to the 50-day exponential moving average at $895, followed by the central pivot level at $829.
Technical indicators on the daily chart reflect a decrease in buying pressure, increasing the chances of a potential collapse. The Moving Average Convergence Divergence (MACD) indicator extends the downward movement after crossing below the signal line on Thursday, indicating an increase in bearish momentum.
Additionally, the Relative Strength Index (RSI) stands at 50 on the same chart, indicating a significant drop from the overbought territory with declining buying pressure.
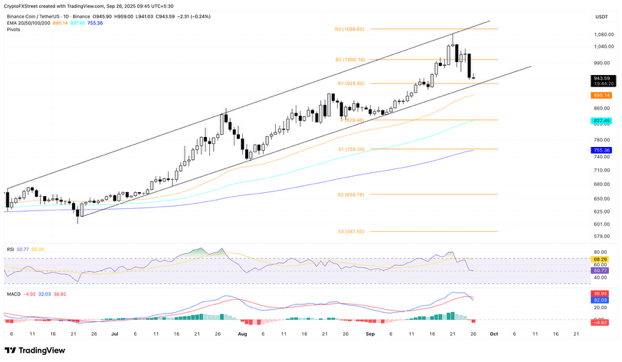
The daily chart for BNB/USDT.
On the upside, if it bounces $BNB from $928, it may retest resistance R2 at the psychological barrier of $1,000.
#binanceBNB #BinanceSquare #BinanceSquareFamily #BNB_Market_Update #Write2Earn