

The crypto market just went through one of its roughest stretches in weeks, with nearly $1 billion in leveraged positions wiped out in a matter of hours. Traders who were riding high on bullish momentum last week are now staring at painful liquidations as Bitcoin, Ethereum, and XRP all slipped below key support zones.
Bitcoin’s Sharp Reversal
Bitcoin’s price action tells the story best. Less than a week ago, BTC was trading around $118,000, boosted by optimism after the US Federal Reserve announced its first rate cut of the year. Bulls hoped this would fuel a fresh rally.
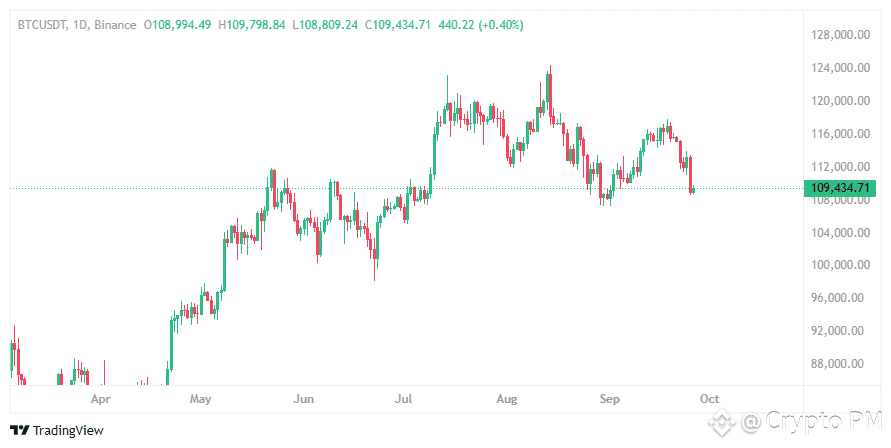
But momentum quickly faded. On Monday, September 22, Bitcoin fell from $115,500 to $112,000, marking the first serious dip of the week. Mid-week, it staged a modest recovery — only for bears to return on Thursday, September 25, pushing BTC down to $108,600 on Binance, its lowest level since early September.
Although it has bounced slightly, hovering just under $110,000, traders are watching that level closely. Analyst Ali Martinez flagged $110,000 as a crucial support, with a secondary floor at $108,530 that has so far absorbed the sell pressure.
Fear vs. Optimism
The steep correction has once again split market commentators. Longtime critic Peter Schiff didn’t waste any time, declaring that this marks the start of a fresh bear market.
Others see the pullback differently. Crypto analyst Captain Fabrik called the move a “healthy retracement” and argued that as long as Bitcoin can reclaim $113,000, the path remains open for a surge toward $140,000.
Altcoins Take Bigger Damage
As usual, altcoins didn’t escape the storm — in fact, most suffered even deeper losses.
Ethereum (ETH): Slid below the $4,000 level and dipped under $3,900 yesterday, making it one of the poorest performers of the week.
XRP: Lost 10% in just seven days, struggling to hold $2.80 as bears continued pressing.
Other large-cap tokens saw similar pain, all dragged down in the wake of Bitcoin’s decline.
$1 Billion in Liquidations
The brutal volatility has punished leveraged traders the hardest. According to data from CoinGlass, total daily liquidations have soared to nearly $1 billion, with over 225,000 traders liquidated within a single day.
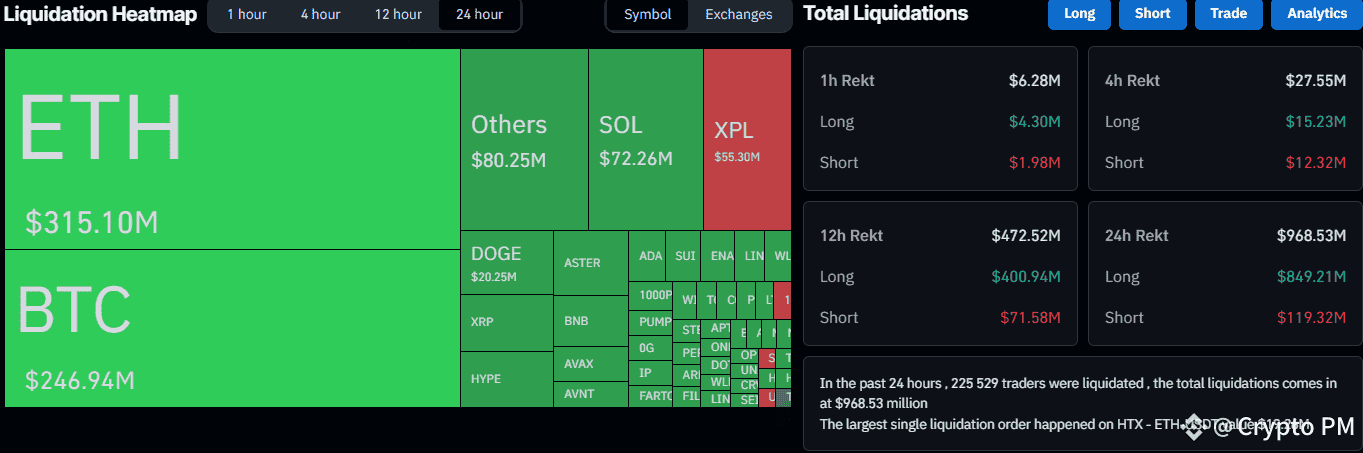
This wave of liquidations highlights how dangerous high leverage remains in a market that can swing thousands of dollars in a matter of minutes.
The Road Ahead
The next few days will be critical. If Bitcoin fails to reclaim $113,000, bearish momentum could deepen and drag the entire market further down. But if bulls defend the current support and push higher, this correction could end up being just another shakeout before the next big move.
For now, the only certainty is volatility — and the fact that over-leveraged traders are paying the heaviest price.
Altcoins Update
1. @Pyth Network

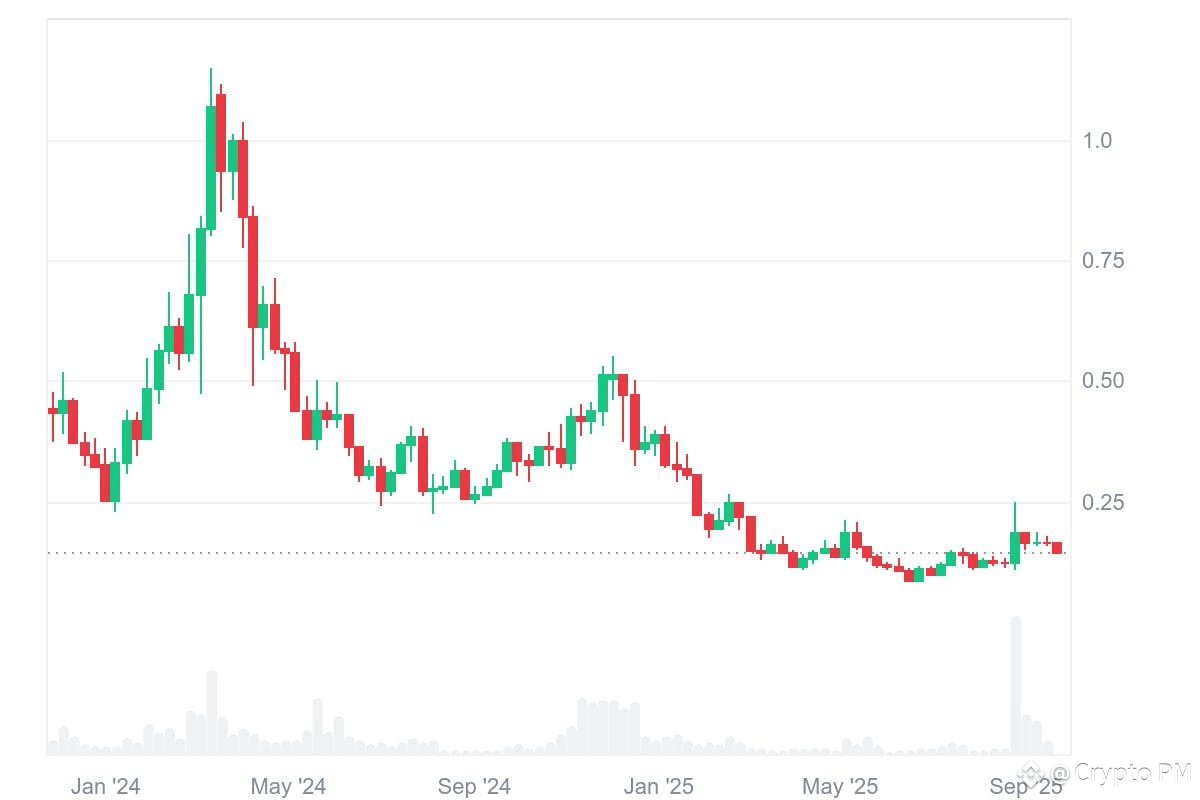
The past 24 hours have not been kind to Pyth Network (PYTH). The token slipped 1.02% to $0.145, underperforming the broader crypto market which fell 1.94%.
After a solid 30-day rally of over 25%, profit-taking and weak sentiment around recent partnerships have pushed PYTH into a technical correction phase.
Technical Signals Point Bearish
$PYTH is trading below key moving averages:
7-day SMA: $0.156
30-day SMA: $0.167
The RSI7 is at 27.3, deep in oversold territory, while the MACD histogram sits at -0.0042, confirming bearish momentum.
The critical breakdown came as PYTH lost the $0.15 support, triggering stop-losses. A potential floor lies at $0.143 (Fibonacci pivot). If this level fails, bears could drag the token toward $0.114, the May 2025 low. #PythRoadmap
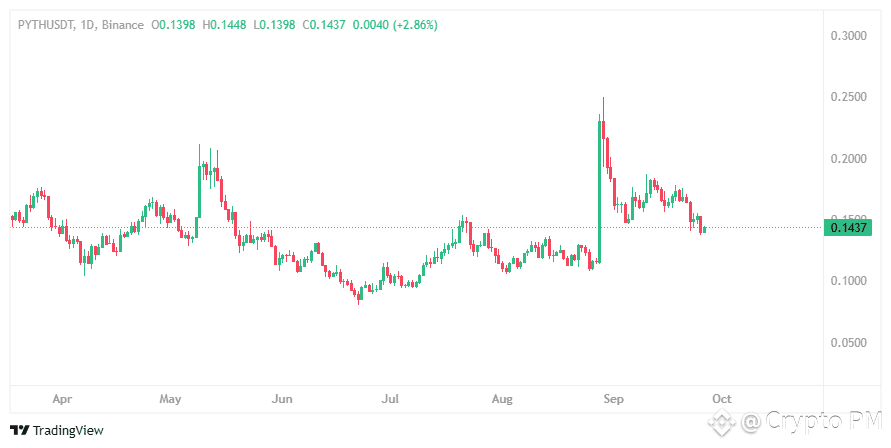
On the upside, reclaiming $0.156 SMA would be an early signal of recovery.
Profit-Taking Meets Market-Wide Dip
Over the past month, PYTH surged 25%, easily outpacing Bitcoin (+0.66%) and Ethereum (-4.9%). But this outperformance made it a target for profit-taking as broader crypto markets corrected.
Other bearish factors:
Open interest jumped 8.24% in the last 24h, suggesting leveraged trading activity.
Fear & Greed Index dropped to 32 (Fear).
24h volume surged 46.6% to $91.9M, showing strong selling pressure.
In short, many traders are cashing in their gains while risk appetite across altcoins fades.
Partnership Hype Losing Steam
Earlier, Pyth saw strong momentum from the U.S. Commerce Department’s August 28 decision to publish GDP data via the network, which sparked a 70% rally. But in recent weeks, no new catalysts have followed.
Meanwhile, competitors like Chainlink remain active in the oracle space, overshadowing Pyth’s growth story.
The ongoing Binance CreatorPad campaign (Sept 4 – Oct 4) with PYTH rewards has not offset these headwinds.
The Bigger Picture
Pyth’s fundamentals remain intact, with institutional adoption signaling long-term relevance. However, short-term price action reflects technical exhaustion, market-wide weakness, and fading partnership buzz.
Key Levels to Watch:
Support: $0.143 → If lost, $0.114 comes into play.
Resistance: $0.156 → Regaining this level could kickstart recovery.
2. @Dolomite

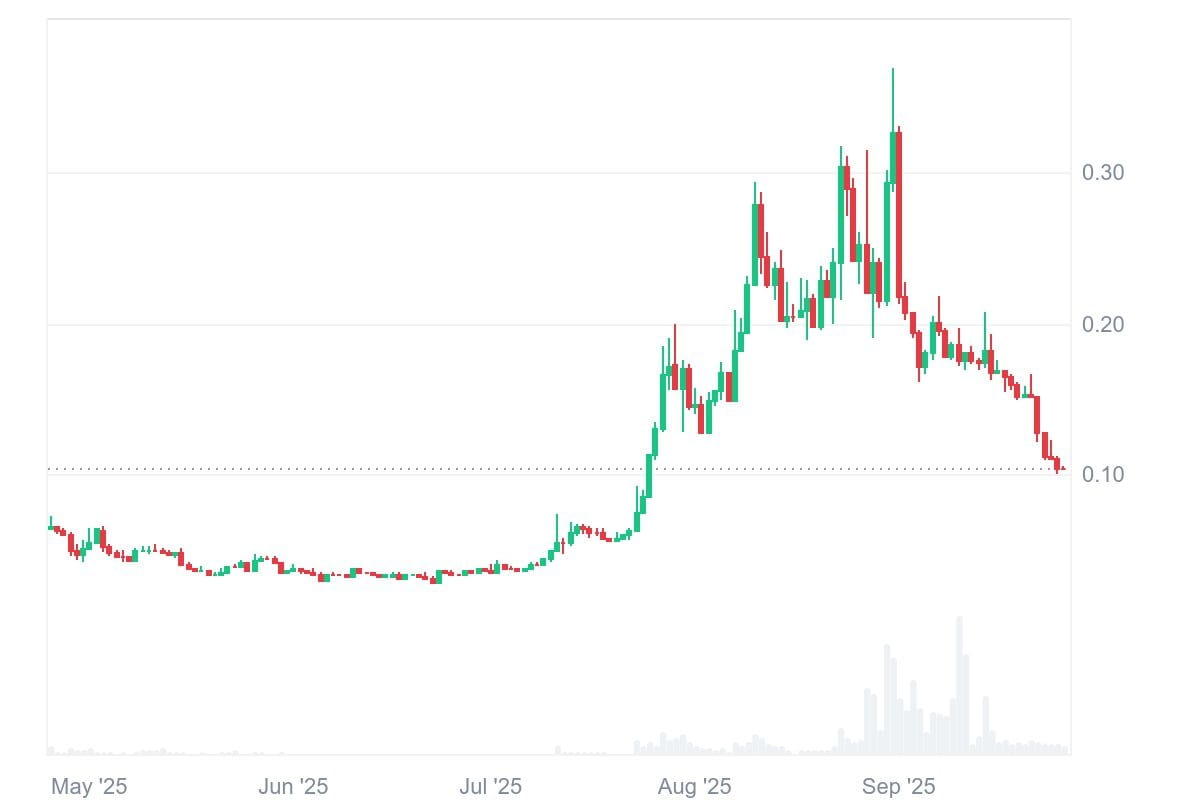
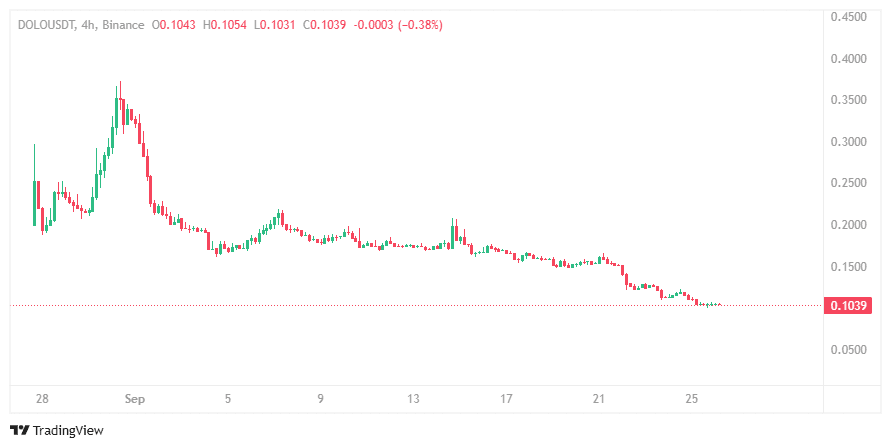
Dolomite (DOLO) showed a minor rebound of 0.17% in the past 24 hours, but the bigger picture remains gloomy. The token is still down 30% over the last 7 days and a staggering 56% over the past 30 days. Despite brief listing-driven pumps, $DOLO continues to struggle against heavy selling pressure and weak technicals.
Post-Listing Volatility: Buy the Rumor, Sell the News
#Dolomite has faced the classic exchange listing problem. Ahead of its Coinbase listing on September 10, DOLO rallied 8%, only to collapse right after trading went live on September 11.
This isn’t new. Earlier, the same pattern played out with its Binance listing in August. Initial hype faded quickly, and by September 26, DOLO was trading at $0.104 — down 57% from its August peak of $0.301.
👉 This shows how exchange-driven rallies in DOLO are more about speculation than sustainable growth.
Technical Breakdown: Oversold but Still Weak
The charts aren’t offering much comfort either. DOLO is trading far below key averages:
7-day SMA: $0.130 (DOLO is 20% under this level)
30-day SMA: $0.183 (DOLO is 44% under this level)
Momentum indicators confirm the weakness:
RSI-7: 13.99 → deeply oversold
MACD Histogram: -0.0063 → bearish momentum still intact
Trading volume is low ($27.8M in 24h turnover), and the closest resistance sits at $0.157 (Fibonacci 78.6% retracement). That makes any meaningful bounce difficult.
The broader market context isn’t helping either — altcoin dominance has dropped 3.2% since August, showing traders are rotating back into safer assets like BTC.
📌 What to watch: A sustained move back above $0.13 (7-day SMA) could trigger a short-term relief rally.
Reward Campaign Adding Sell Pressure
On top of weak technicals, tokenomics are also weighing DOLO down.
Binance’s CreatorPad campaign (Aug 31 – Sept 30) is distributing 330,000 DOLO tokens as rewards for content and trading activities. While this boosts engagement, it’s also creating extra sell pressure as recipients cash out their rewards.
Since its Binance listing in August, DOLO’s circulating supply has surged 26%, adding to dilution fears.
Conclusion: Bearish Trend Intact Unless a Catalyst Arrives
DOLO’s story right now is one of post-listing exhaustion, weak technicals, and supply dilution. While oversold conditions mean a short bounce is possible, the broader trend remains bearish unless new catalysts appear.
Key Watch: Can DOLO defend the $0.10 support as Binance’s campaign nears conclusion on September 30? If not, the token risks sliding into deeper lows.
3. @WalletConnect

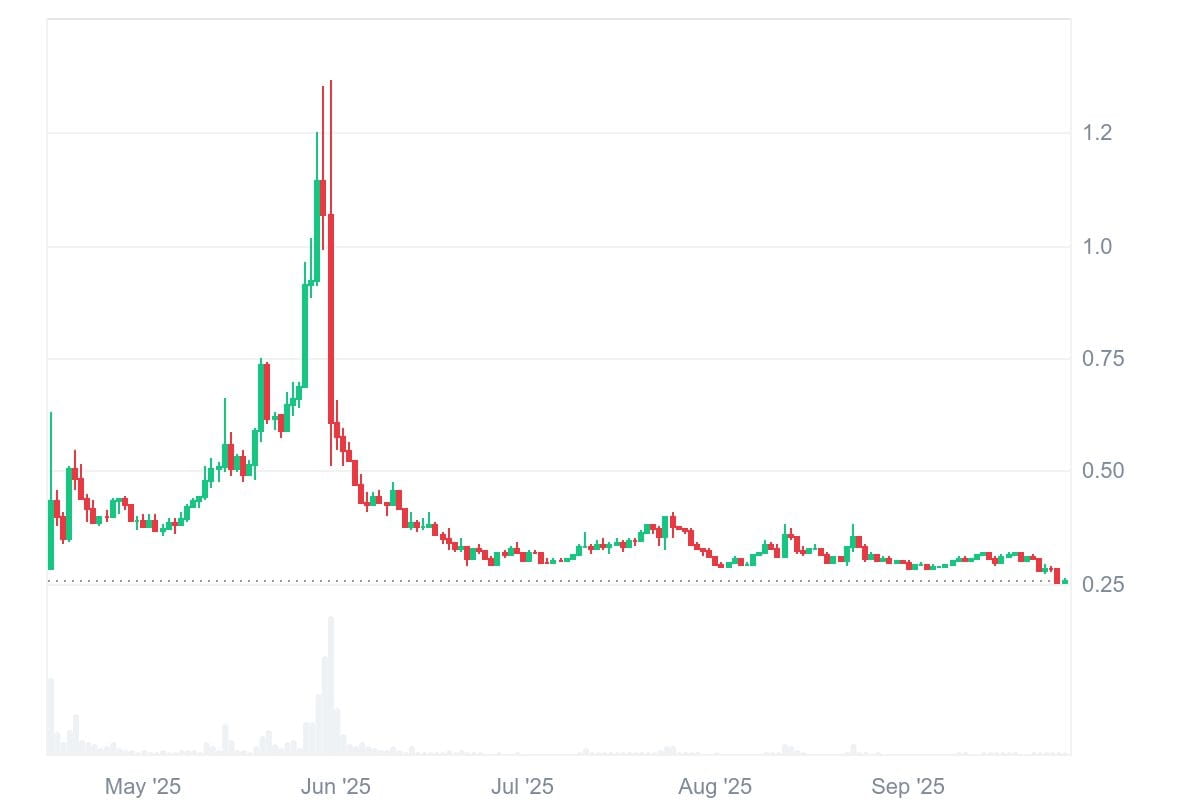
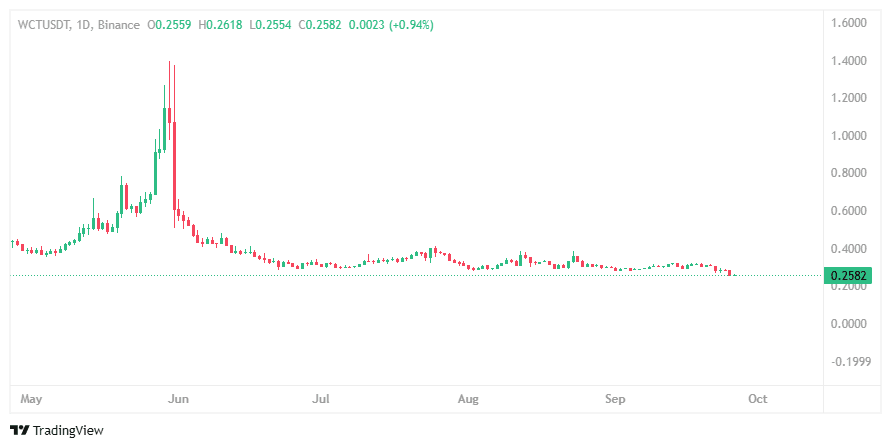
#WalletConnect Token (WCT) has come under pressure again, dropping 3.93% in the last 24 hours and underperforming the broader crypto market, which fell 1.99% over the same period. The weakness comes as traders lock in profits from its recent Coinbase-related pump, technicals flash bearish signals, and risk sentiment across the market remains low.
Post-Listing Profit-Taking: The Coinbase Effect
On August 12, $WCT spiked 11% to $0.3649 after Coinbase added it to its roadmap, particularly linked to its Optimism integration. But the excitement didn’t last long.
By August 14, when trading officially began, the token slipped to $0.31 as early buyers cashed out in a “sell-the-news” move. With a 24h turnover ratio of 1.14 (signaling high liquidity), traders quickly rotated out, dragging the token below its key $0.30 support.
👉 Key watch: Whether WCT can sustain healthy volume on Coinbase Optimism pairs. Low liquidity would make it more prone to sharp swings.
Technical Setup: Bearish Bias Persists
Chart indicators suggest more downside risk for WCT:
RSI (14): 32.59 → near oversold but not yet extreme
MACD Histogram: -0.0043 → bearish momentum intact
7-day SMA: $0.2896 → price is trading below it
30-day SMA: $0.2987 → confirming medium-term weakness
Pivot points show that $0.26 is the critical level to watch. A breakdown here could trigger short trades and accelerate the decline. On the flip side, the $0.3053 Fibonacci 23.6% retracement has now flipped into resistance.
👉 Key watch: A close above the 7-day SMA ($0.29) would signal the first sign of relief.
Broader Market Weakness Adding Fuel
The total crypto market dropped nearly 2% in the last 24h, with Bitcoin dominance rising to 58.23%. This capital rotation away from altcoins has worsened WCT’s decline.
Data shows WCT has a 0.78 correlation with Bitcoin. That means when BTC wobbles, WCT tends to move even more sharply — making it especially vulnerable in risk-off conditions.
Conclusion: Bearish Trend Unless $0.29 Reclaimed
WCT’s decline is driven by a perfect storm of profit-taking post-listing, weak technicals, and overall market risk aversion. While its RSI suggests a possible short-term bounce, the broader picture remains bearish until buyers reclaim higher ground.
Key Watch: Can WCT defend the $0.25–$0.26 support zone, or will further Bitcoin strength force another leg down?
