The price $BTC has fallen to new lows below $109,000, and although the charts indicate that the sell-off is far from over, data shows that buyers in the spot market are accelerating their accumulation.
Key points:
The Bitcoin sell-off has intensified, but data shows that buyers in the spot market are increasing the size of their distributions.
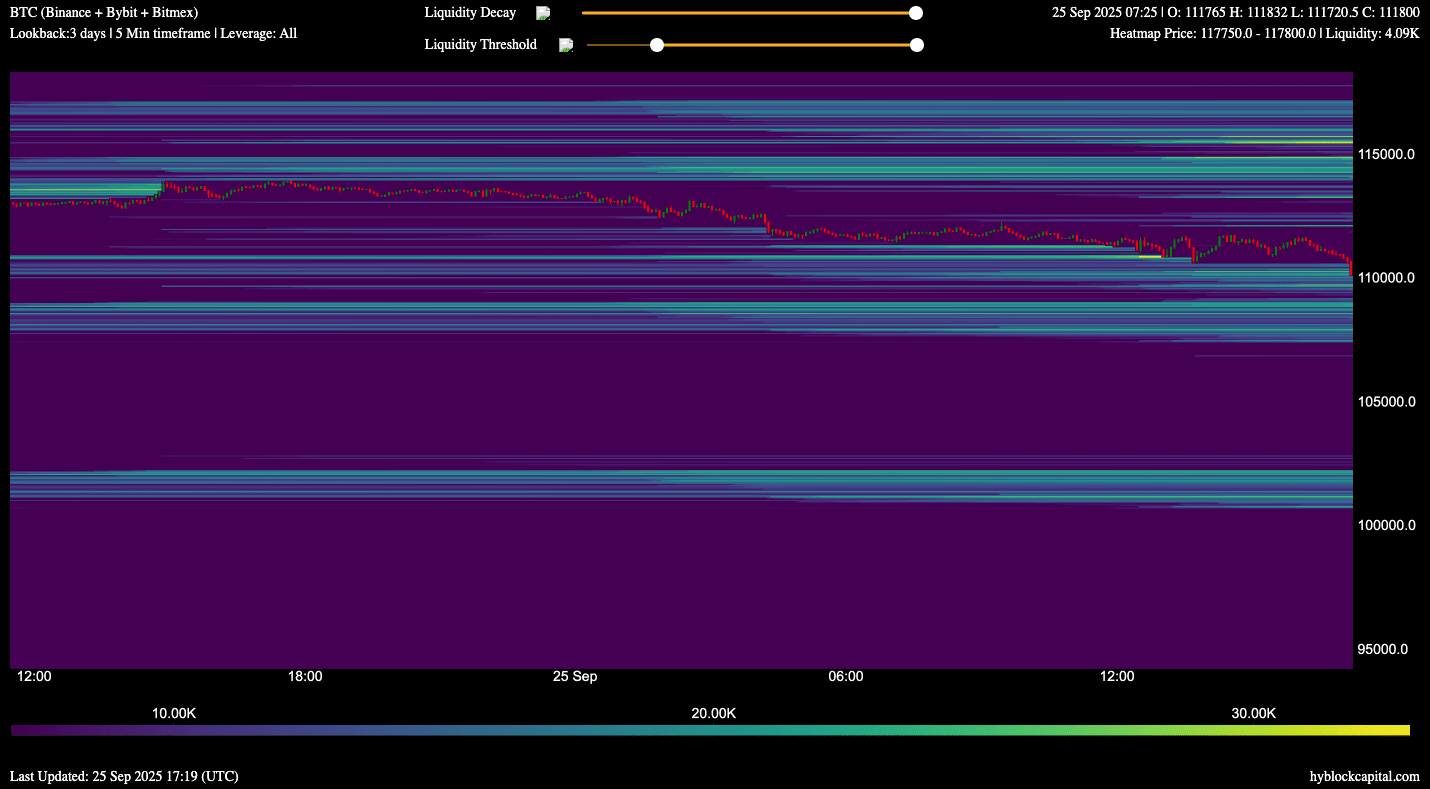
The liquidation heat map data indicates that the sell-off may continue until $107,000.
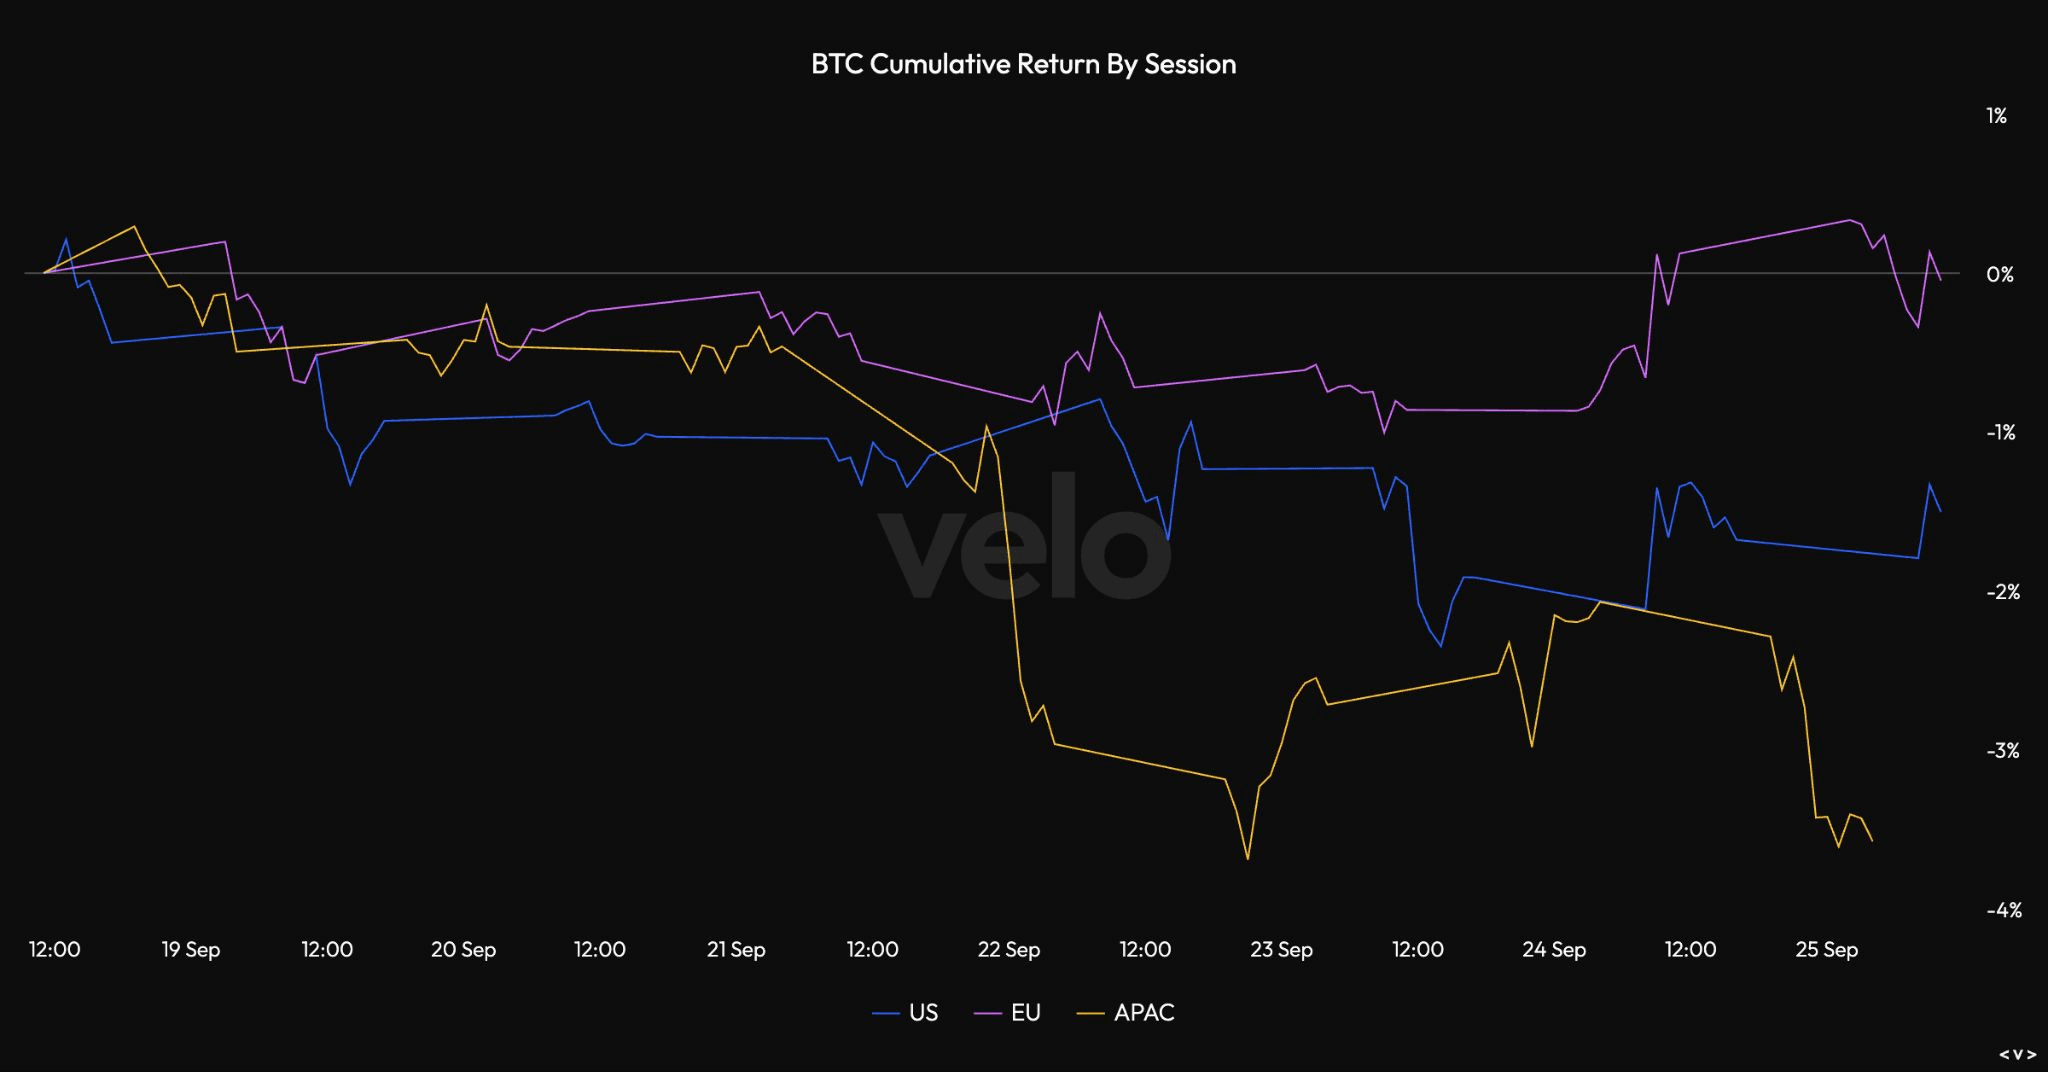
BTC fell to a two-week low at $108,865, and although several organizations showed interest in buying at the range lows this week, sales during the Asian trading session negated the profits gained from each bounce during the American session.
Throughout last week, traders actively bought at intraday lows, however, the liquidation heat map data from Hyblock shows a cluster of liquidations consisting of long leveraged positions that are at risk of being absorbed at levels from $111,000 to $107,000.
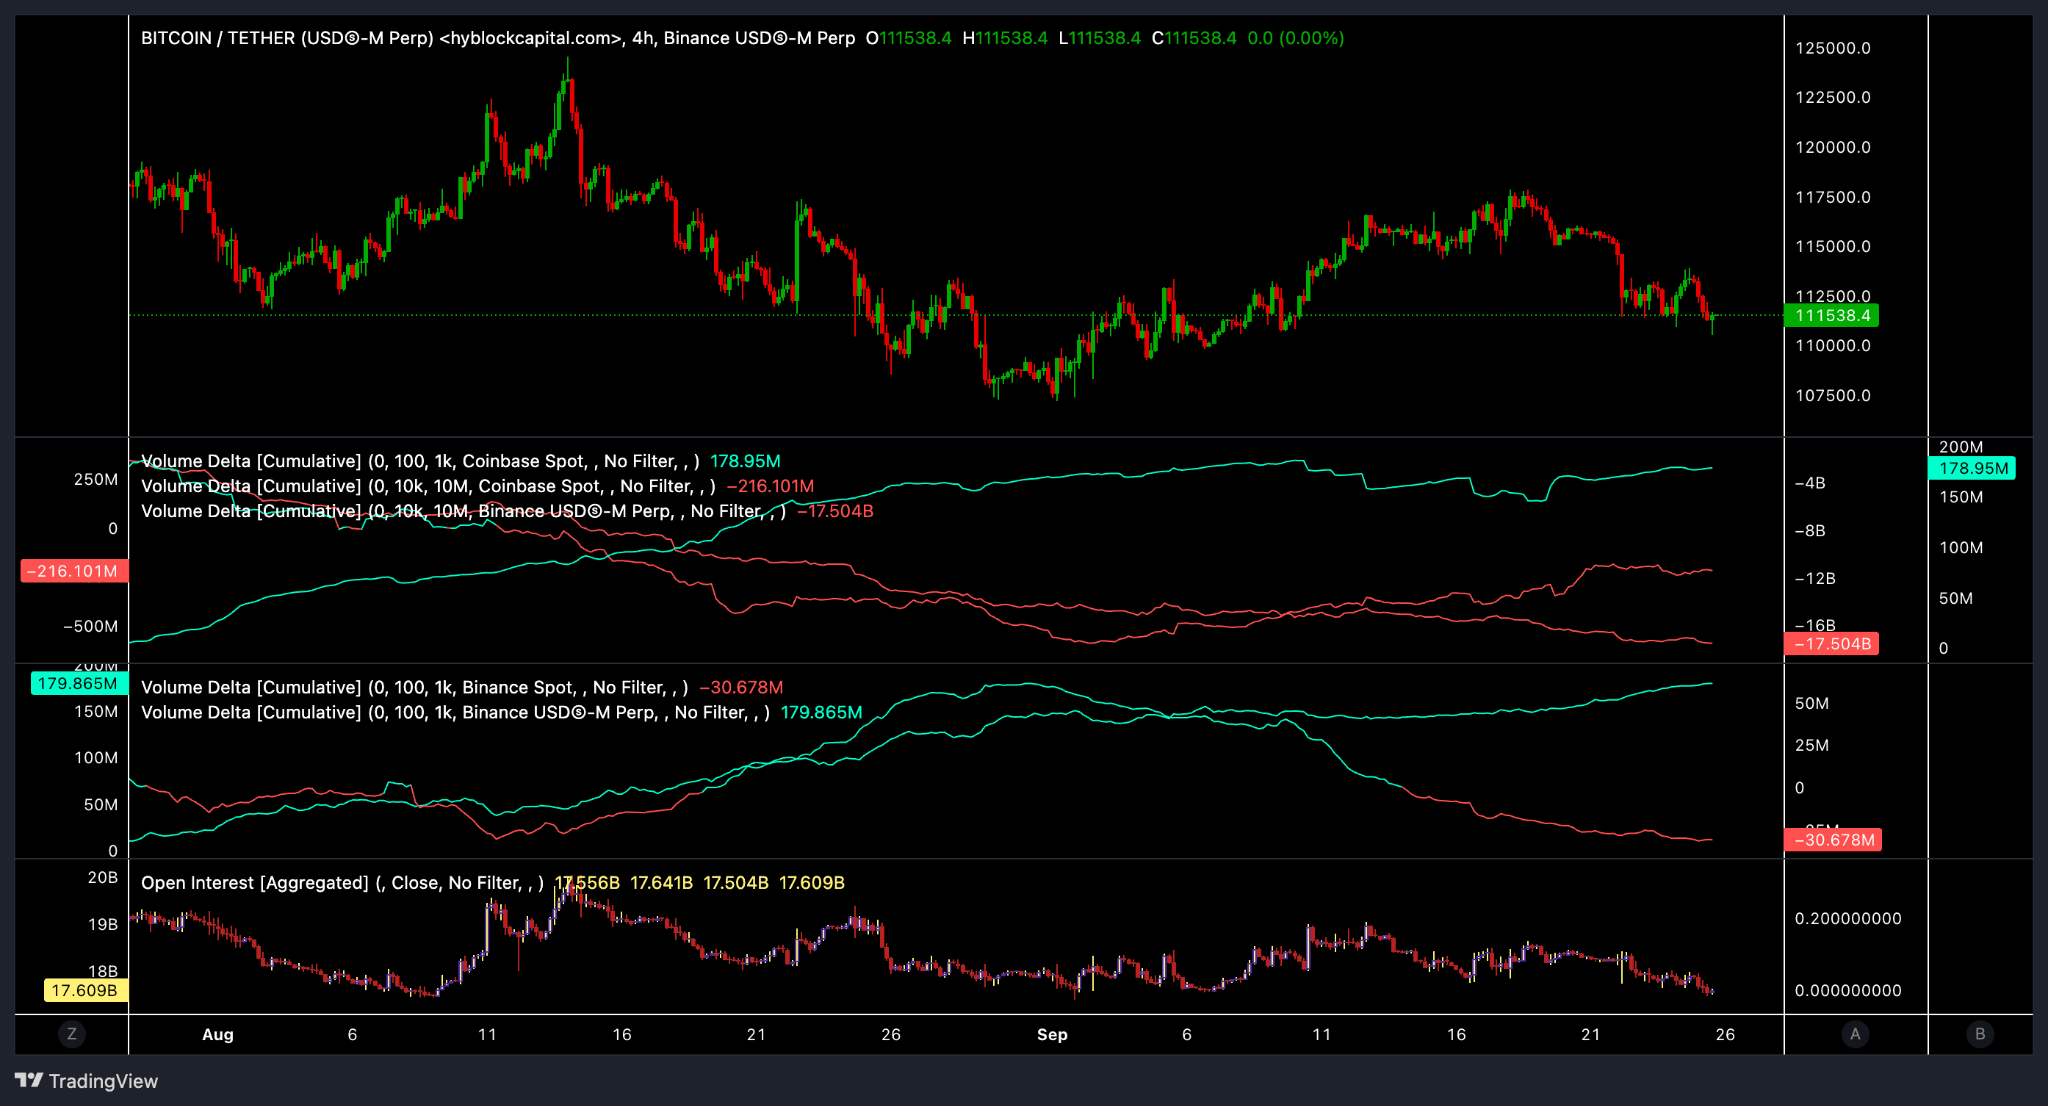
In addition to the risk of liquidation to the downside, activity in the perpetual futures markets continues to dictate the daily price dynamics of Bitcoin, and active sales from institutional investor groups (from 1000 to 10 million) continue to outweigh spot purchases observed among retail investor orders (from 100 to 1000).
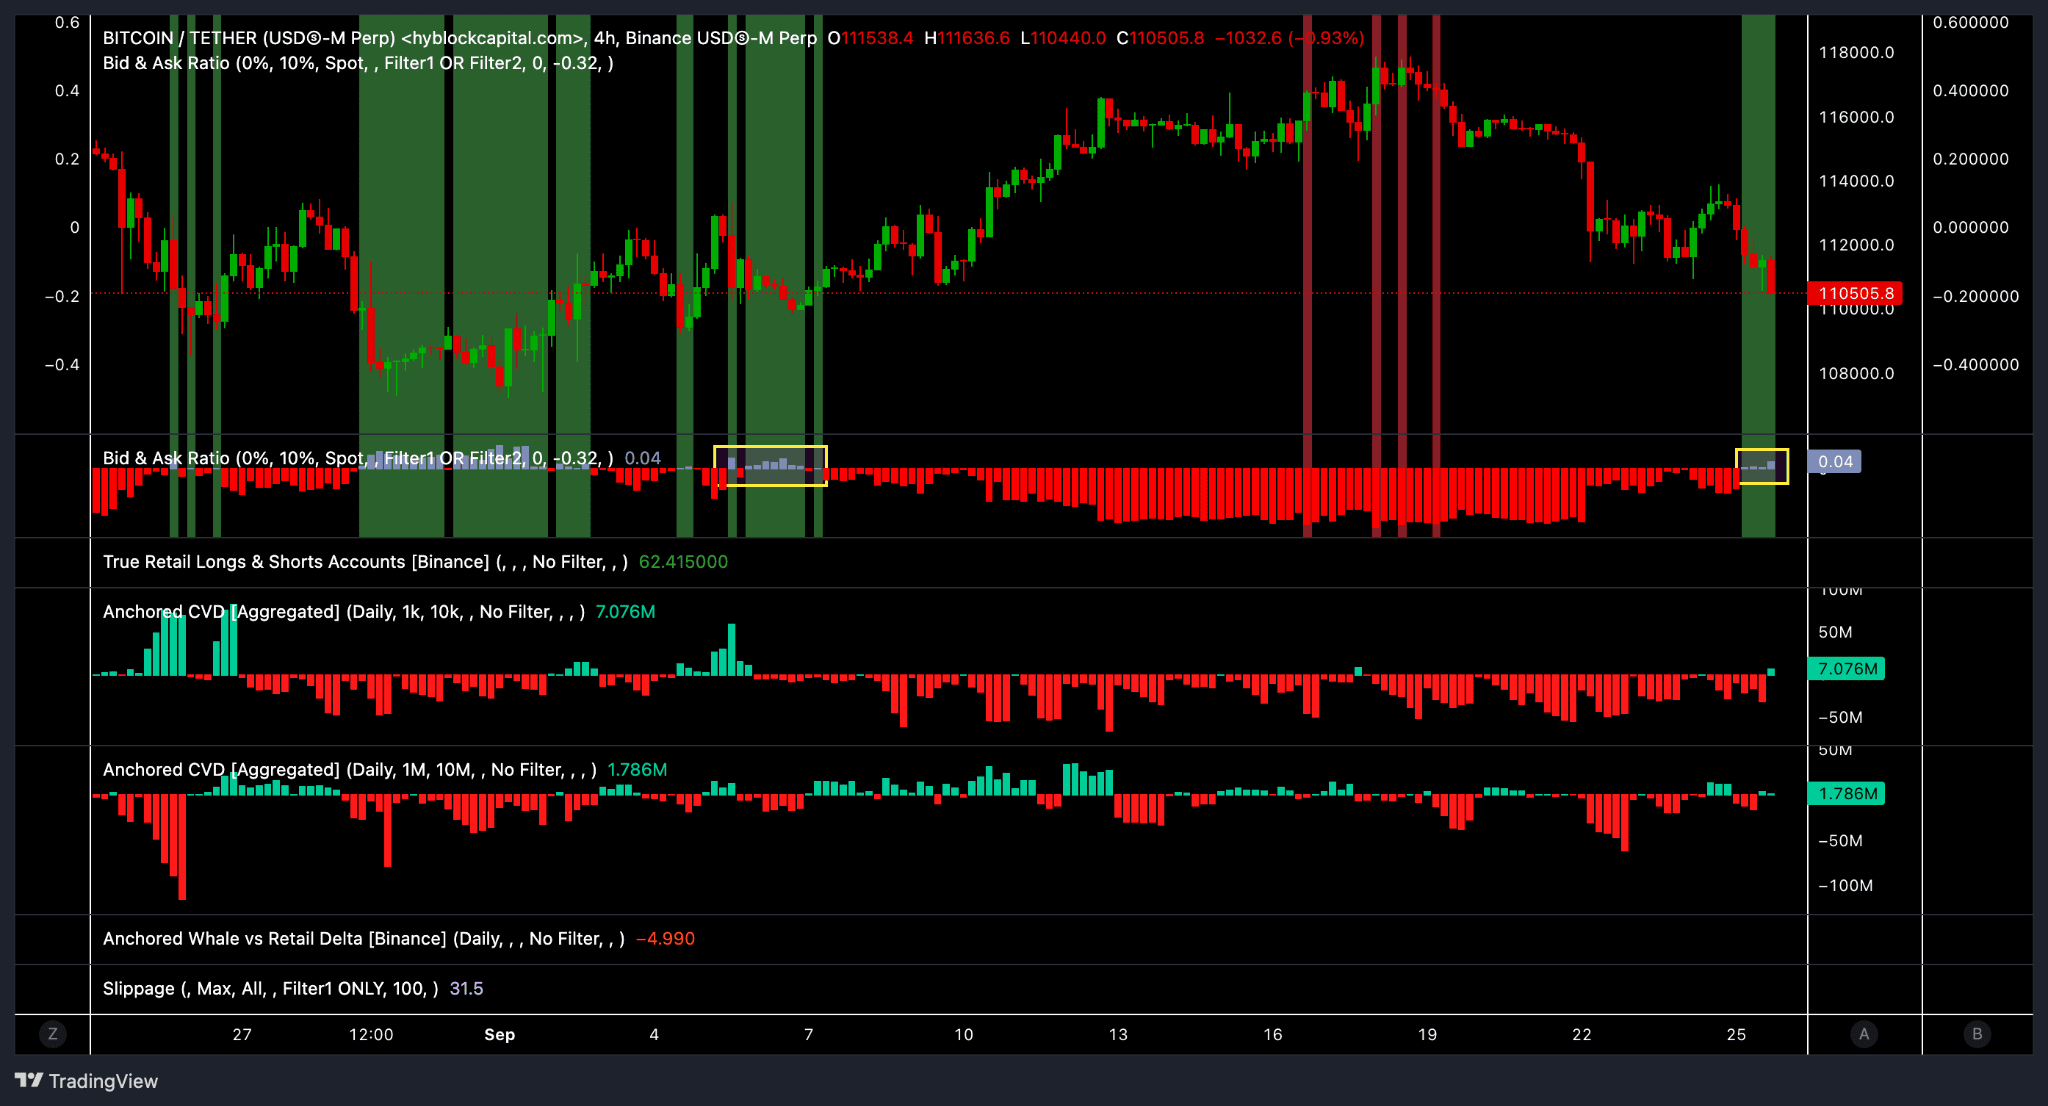
Despite Bitcoin nearly falling below $110,000, a notable event of the day was that the cumulative supply and demand ratio in the spot order book once again tilted in favor of buyers. This metric measures "the ratio between the number of buy (bid) and sell (ask) orders in the order book," and this ratio ranges from -1 to 1, where a zero value indicates an equal number of buy and sell orders in the order book.
"A supply and demand ratio above 0 indicates that there are more buy orders than sell orders in the order book, which may indicate higher demand for the asset at the current price level"
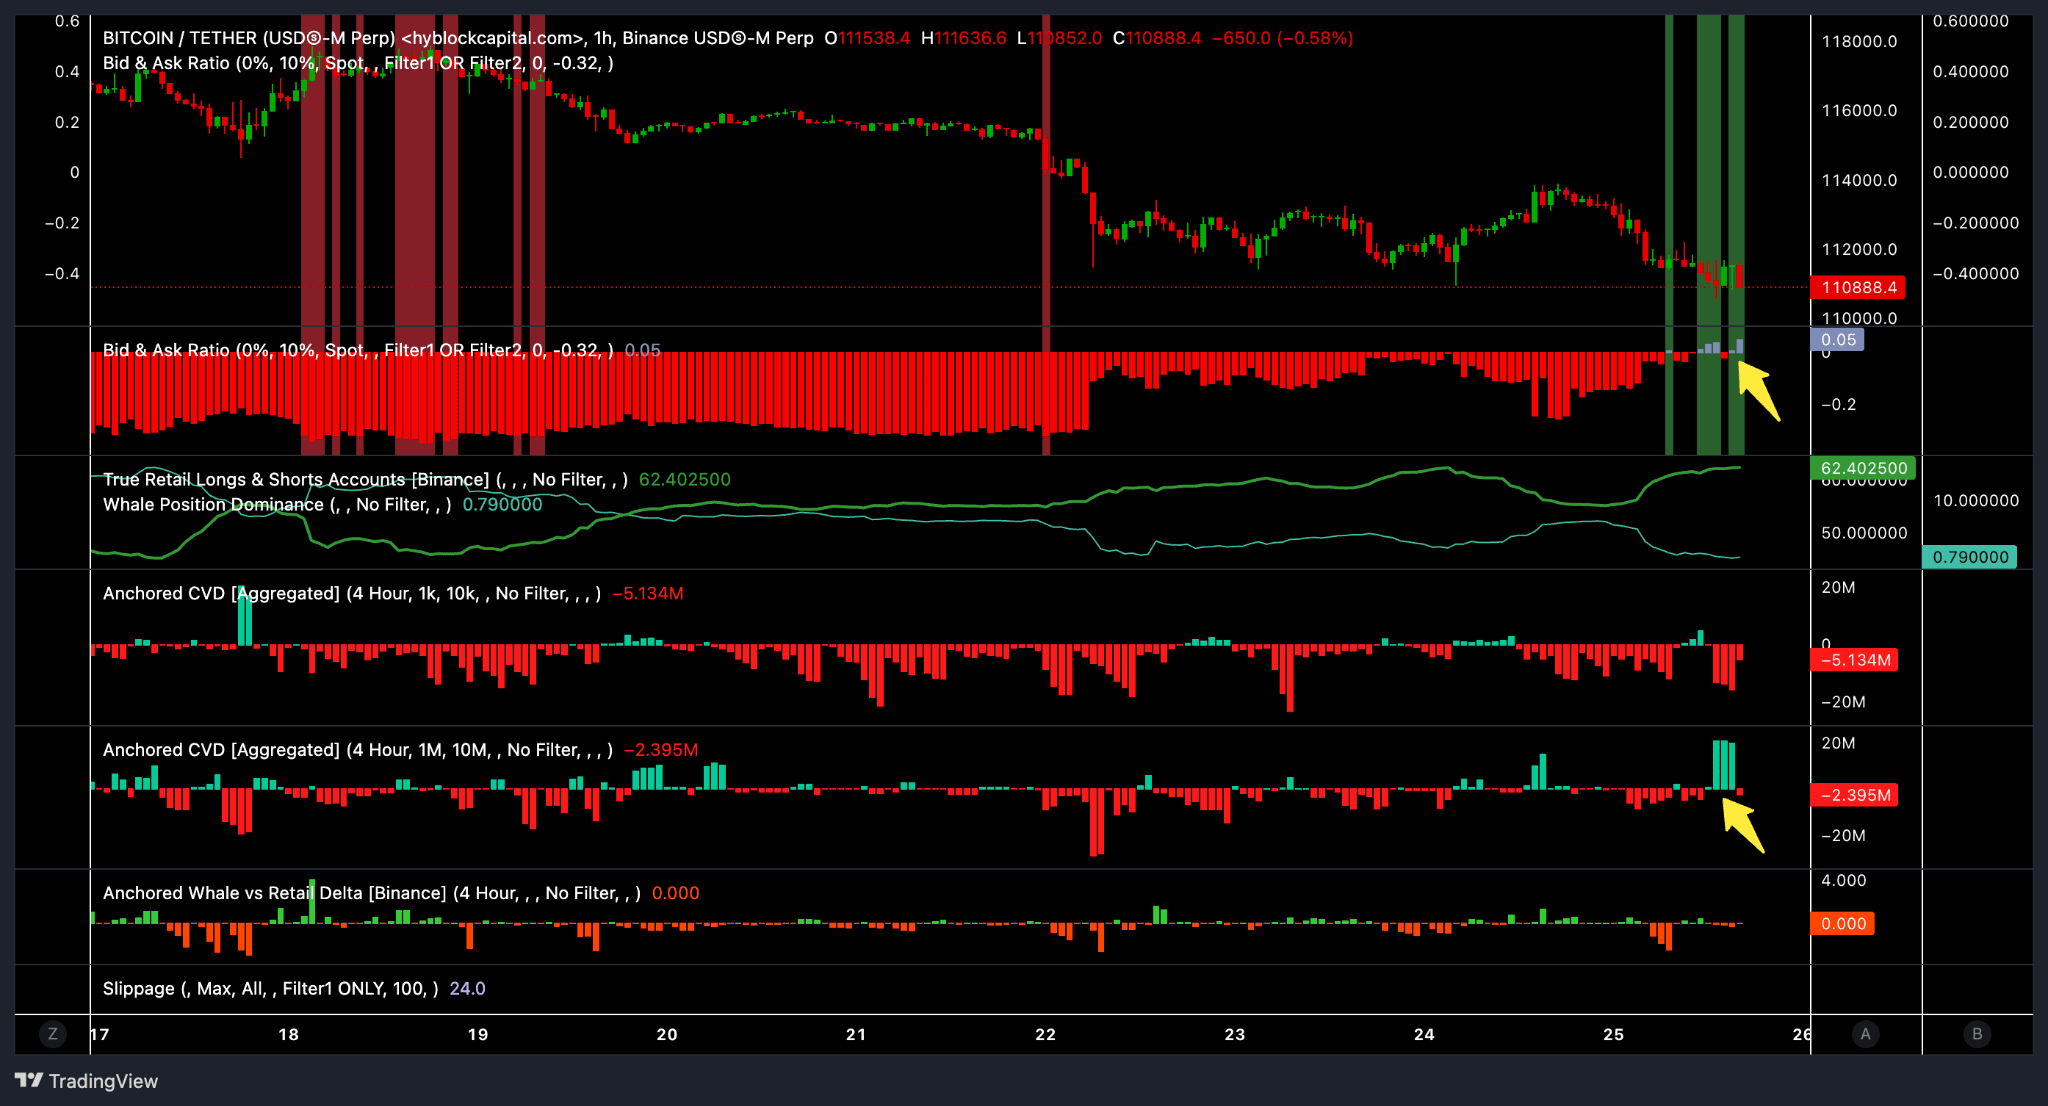
Although spot trading volumes pale in comparison to the buying and selling volumes observed in the perpetual futures markets, the re-emergence of a demand and supply ratio skewed towards bulls is the first since it was last observed from September 5 to 7, just before BTC rose from $107,500 to its recent peak of $118,200.
Let's see what happens next......
#Binance #bitcoin #altcoins #crypto #analysis