After thinking for a long time, I decided to share my short-term trading principles, which started from 50,000 and reached 53,980,000 in just two years in the cryptocurrency market!
If you are losing now and want to make trading cryptocurrencies your second career in the future, then please read this carefully, you will definitely gain something, and I suggest you save it!
I went from huge losses to financial freedom, achieving a 2000 square meter villa and a Land Rover + a small Rolls Royce in Shanghai!
I tell you with ten years of experience, if you don't understand 'Yin and Yang (candlestick)', don't enter the market! Otherwise, you will definitely lose! (With illustrations)
Continue trading cryptocurrencies like this! Earning a million is achievable.
1. Only do high-sell and low-buy of BTC/ETH
2. Use the 4H moving averages above the significant resistance level to determine when to enter a short position. For example, if the 60-day moving average above the 4H level is continuously suppressing the price, use this moving average as the entry point for a short position. Stop-loss: Set it at the previous high after a spike and then a pullback. For example, if the resistance level is 2440 and the spike reaches 2450, then place the stop-loss above 2450.
3. Generally, the lower support level of the same level or a higher level is used as the entry point for long orders in batches. Stop loss: It is placed at the previous low after the downward pin and subsequent rise. For example, if the support level is 2320 and the pin reaches 2310, then the stop loss is placed below 2310, around 2300.
4. Stop-loss principal: 20% of the total principal. If this amount is reached, no more orders will be opened on that day. Single-day operations are generally based on two transactions, with a single stop-loss control of 10%. The position size of a single order should be consistent.
5. Try to enter the market in batches instead of all at once! Try to follow the trend to open orders. When the main trend is short, try to open short orders, and vice versa.
① When the market trend is good, chase hot coins
②Control the profit and loss ratio to around 3:1
③ The daily stop loss retracement is 15%-20% of the principal. If it reaches this level, no more orders will be opened on that day.
④ Daily review
6. Crashing market: Wait for the market to open in batches. If there is no opportunity, just wait for the market to open. In this market, not losing money is equal to making money.
7. Guaranteed Win Stop-Loss: If the stop-loss condition is met and the K-line pattern of the same level is not broken, then the guaranteed win stop-loss pattern is not required. If either condition is not met, the guaranteed win stop-loss pattern is required. ETH: Guaranteed win after 20 points of floating profit BTC: Guaranteed win after 350 points of floating profit
8. Moving Take Profit: ETH: Move the take profit after 35 pips of floating profit, using 3/5 minute intervals for moving. BTC: Move the take profit after 500 pips of floating profit, using 3/5 minute intervals for moving.
9. 1. Never think of all-in gambling and getting rich quick. 2. Only follow your own market! Learn to hold short positions and don't force orders. 3. Don't place orders overnight. 4. Try not to place orders on weekends. 5. After being stopped out, keep your mind in check.
If you think of digital currency as a game, the players have different roles: project owners, exchanges, miners, and countless investors. Everyone follows a consensus mechanism and performs their respective roles within the game ecosystem.
The Technical Trader's Bible: The Essence of the Rockefeller Trading Method (Dry Goods Edition)
There are four situations in which a Rockwell Hawk structure (Rh structure) is formed:
1. After a low 1-2-3 structure is broken, the first candlestick that does not reach a higher high makes the Rh structure form.
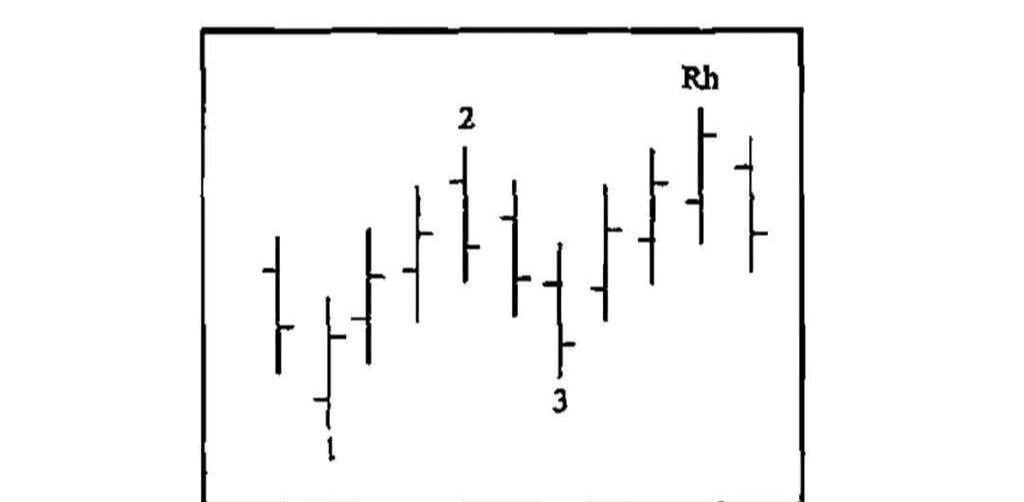
2. After a high 1-2-3 structure is broken, the first candlestick that does not show a lower low point forms the Rh structure.
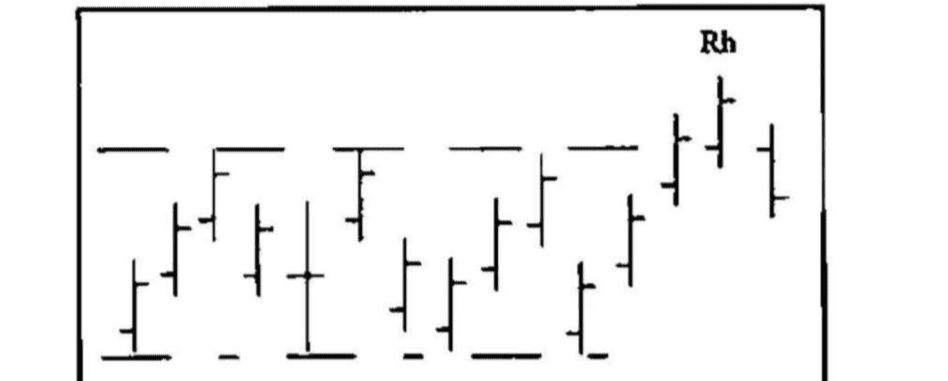
3. Any horizontal movement structure, including the pause structure (abbreviated as LG structure), the consolidation structure (abbreviated as CG structure), and the oscillation structure (abbreviated as TR structure), is broken upwards. The first K-line that does not reach a higher high point will form an Rh structure.
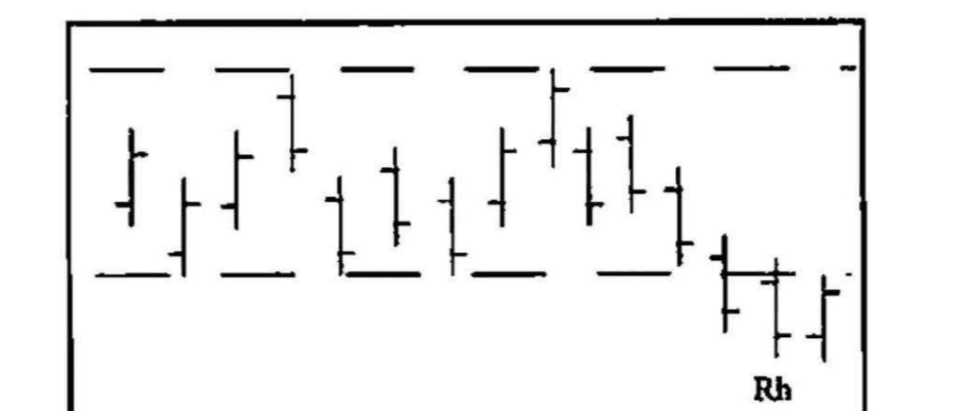
4. Any horizontal movement structure, including the pause structure (abbreviated as LG structure), the consolidation structure (abbreviated as CG structure), and the oscillation structure (abbreviated as TR structure), is broken downwards. The first K-line that does not reach a lower low point will form an Rh structure.
The Rockhawk trading method is similar to naked K trading, without any complexities. The market continues to form new Rockhawk structures as it continues its upward trend:
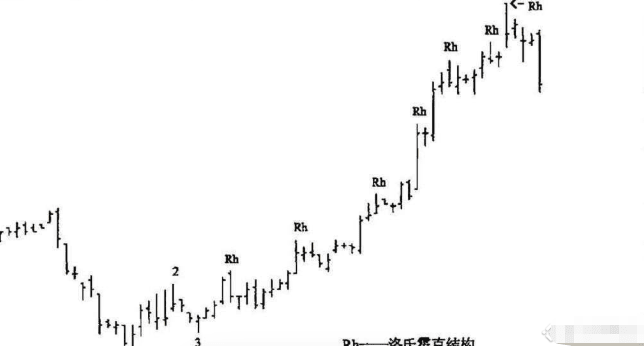
Sometimes point 1 is difficult to confirm, but points 2 and 3 are always easy to confirm. I like trading Rocky Hawk patterns because they represent market truth. A breakout is market truth. Once the price breaks through a Rocky Hawk point, it's a breakout. Even if the breakout later proves to be a failure, the price still broke through, and the strong momentum that usually accompanies the breakout gives me a chance to at least protect my capital.
Let me share with you a set of practical strategies that I have used for many years. The average winning rate has reached 80%, which is a rare achievement in the cryptocurrency trading world.
The indicators you must know when trading cryptocurrencies [Yin-Yang K-line winning rate exceeds 90%] Once you learn and master them, the cryptocurrency market will become your "cash machine"
If I could go back in time, I would go back to the time when I first entered the trading market.
I wish someone had reminded me of the importance of the Yin-Yang line and told me that it is the foundation of trading.
Then I will not pursue a winning strategy and waste time pursuing the parameters of different technical indicators.
This way I won't take so many detours.
Want to make a profit in the market, especially in the cryptocurrency world
You don’t have to know some very advanced economic theories, you don’t have to know how to interpret the indicators behind each economic data, and you can ignore all technical indicators.
No need at all
But there is one thing you must understand thoroughly, and that is the Yin-Yang line (K line).
If you are just starting to trade, you may find the Yin-Yang lines very complicated and you may not understand what is going on.
But don't worry, it's not as complicated as you think.
In this article, I will use a very simple and clear method to take you step by step to understand this matter from the shallow to the deep.
If you like this article, please give me a thumbs up at the bottom.
Your support is my motivation!
Nothing is more important than price on a chart.
The Yin-Yang line uses a graphic method to show the fluctuation of prices in a certain period of time, the results of the battle between bulls and bears, how the market thinks about the direction, which party has control, etc.
All of the above can be traced through the Yin-Yang line, which is the threshold for technical analysis.
If we understand the meaning behind each yin-yang line, no matter which type of technical analysis you personally prefer, you can get twice the result with half the effort.
Next, I will lead you to interpret the Yin-Yang line in three levels (three levels)
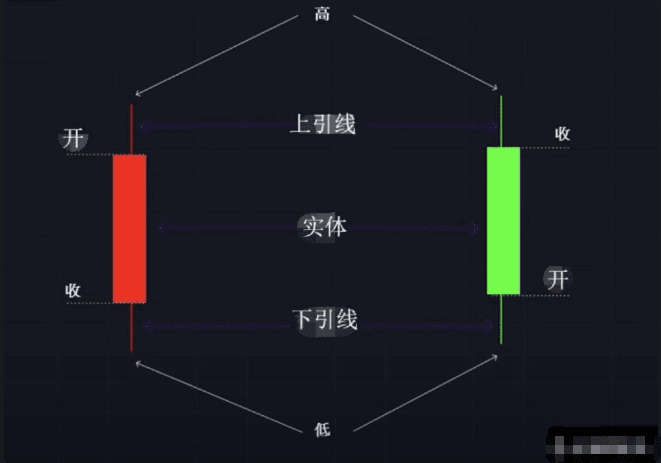
First, I will break down the Yin-Yang line into 4 parts
To interpret its surface information
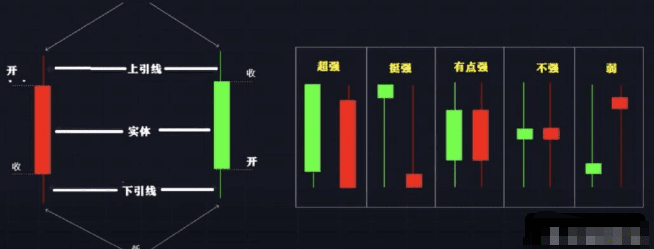
Then I will summarize the Yin-Yang lines into 5 different levels of strength
To interpret the hints behind the Yin-Yang lines
Finally, I will introduce you to the 4 most common Yin-Yang line patterns.
How to define them,
What they mean and how to apply them
After reading this, you will understand how to use the Yin-Yang line to find a lot of information that helps you analyze the market.
At the same time, you will also understand why I say that the Yin-Yang line is the foundation of market profit.
Let’s get started!
Here I will teach you how to interpret the information that a Yin-Yang line brings to us on the surface.
When disassembling a Yin-Yang line
Can be divided into 4 key points
They are color, opening and closing high and low, body and shadow
Before we talk about the 4 key points, we must first know one thing
Each Yin-Yang line represents the price fluctuation within a certain period of time.
If you use a one-minute chart
Each yin-yang line records the price fluctuation within this minute.
If you are using a daily chart
Each yin-yang line records the price fluctuation in the past 24 hours.
Color is our way of distinguishing whether this Yin-Yang line is a Yang line or a Yin line
Generally speaking, red represents a negative line.
Green represents the Yang line
A bullish candlestick means that the closing price is higher than the opening price within a certain period of time.
The opposite is true for the Yin line
When the Yinxian ends
The closing price is lower than the opening price
So we can know one thing through the color of the Yin-Yang line
Is the temporary control of the market in the hands of buyers or sellers?
Next is the opening and closing high and low
I believe you have mastered these basic knowledge
This is a simple matter

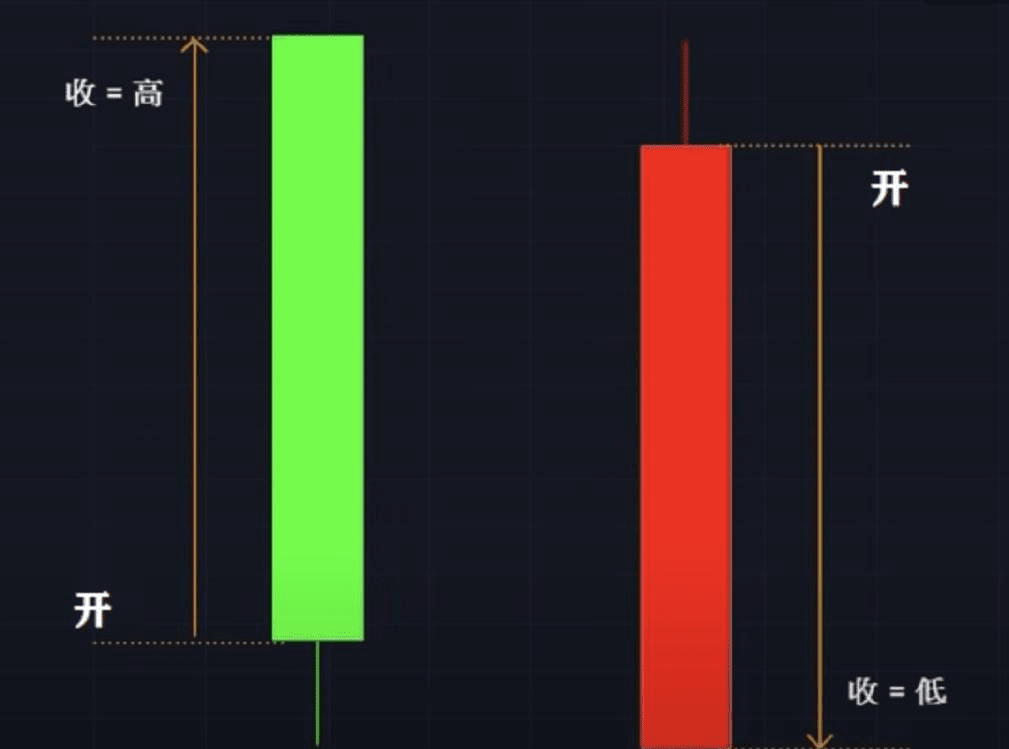
We use Yinxian and Yangxian as examples respectively.
The Yang lines from top to bottom are open high, close high, open low
Just like what I said before
His closing price is above his opening price
The Yinxian lines from top to bottom are high opening and low closing
The opposite of the Yang line
Its closing price is lower than its opening price
Next, let’s talk about the physical line
The real body means the actual price movement range in a specific period of time.
Take the Yin-Yang line of a daily chart as an example
For example, its opening price this morning is 10 yuan
After a day of repeated trading
No matter if it has increased by 15 yuan
Or maybe it once dropped to 7 yuan.
This position will only record the price at the moment when the Yin-Yang line ends.
It's what it costs
Finally, the shadow line
The shadows represent the highs and lows that the price has reached
A lot of important information can be seen from the shadows
I personally think that shadow line is a very important part of interpreting the market.
I'll keep it a secret here for now
In the last part I will use the candlestick patterns (K-line patterns)
Explain it to you in more detail
Next
Let's start to dig deeper
If we use watching a movie as an analogy
When you finish watching a play
You know how the story develops.
Beyond the superficial message the movie gives you
Would you like to think about this movie further?
It wants to convey a deeper meaning and message
Do you have any insights and personal interpretations?
If we apply this concept to the market
Each K-line represents a story
This story has both long and short parts
The shortest one can be less than a minute
The longest one can be more than one month
It depends on what time chart you are using.
Every story has a beginning, a middle and an end.
On the surface, the yin and yang lines of this daily chart tell you:
My opening price was 10 yuan, and within 24 hours, the highest price reached 18 yuan. The lowest price was 7 yuan, and my closing price was 13 yuan.
These are the plots of a story
If we interpret and reflect on this story more deeply
You will find many surprises
And these findings can effectively help you interpret the market
Next we are about to enter the [Secrets behind the Yin-Yang Line]
I'll give you a few examples in order of intensity.
Explain to you in more detail
The secrets behind different types of yin-yang lines
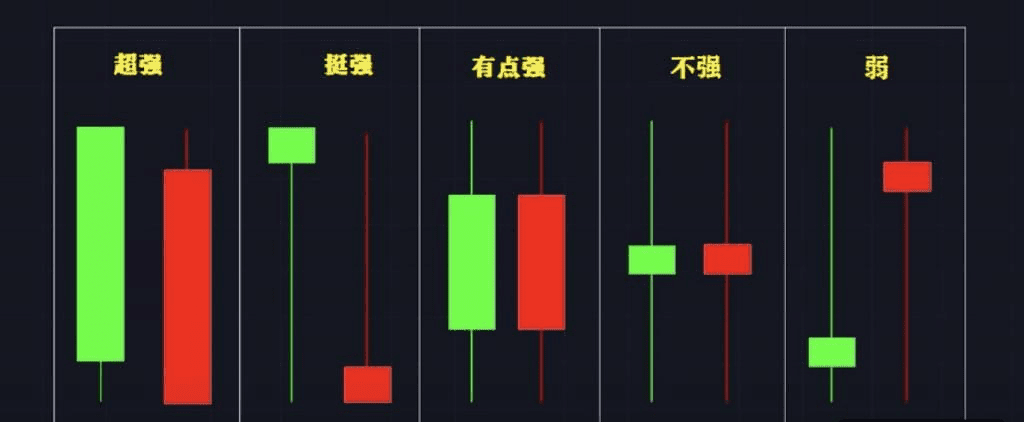
Here I will summarize the Yin-Yang lines into 5 levels of strength
The first
The entity is very long
And there is almost no shadow line
A most powerful yin and yang form
Entity represents one party with almost complete control
Take this Yang line as an example
Buyer's intention
And it has the ability to push prices up within a certain period of time
on the other hand
The shadow part is almost invisible
Represents the absence or opposite power is very weak
We see that the upward or downward forces are almost unimpeded.
It means that most market participants agree that the price will move in this direction.
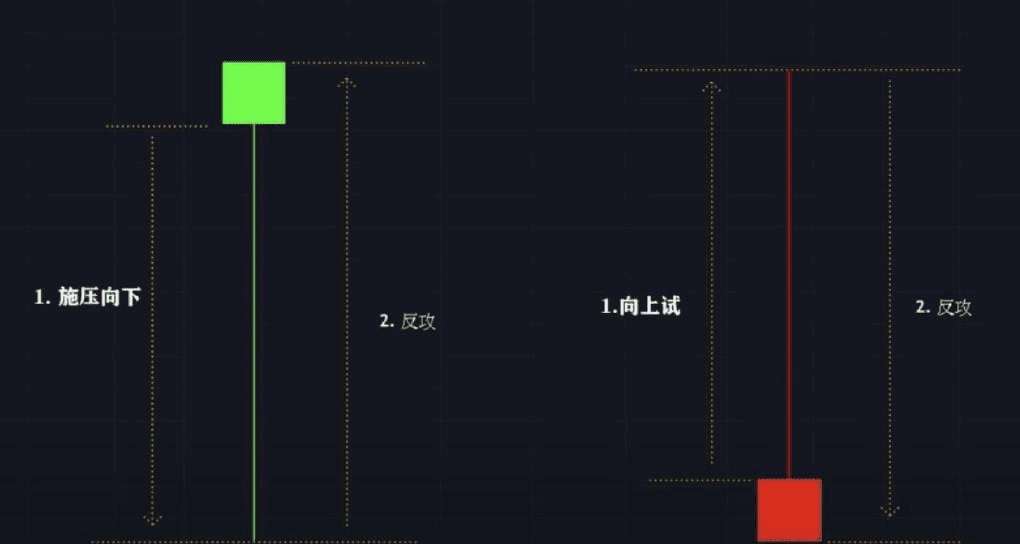
The second
We see that this type of Yin-Yang line has a very long shadow.
It was once a big Yang or Yin line.
But I have been under strong pressure from the opposite direction.
The defending team showed great determination and strength
Finally, they successfully recovered the lost land
Still have control at the end of the Yin-Yang line
Although its body is relatively short
But if we think deeper,
You will understand
The distance it travels is actually not shorter than the first type of yin and yang line.
This type of candlestick pattern is called a shooting star or hammer.
We'll look at some chart examples later.
OK
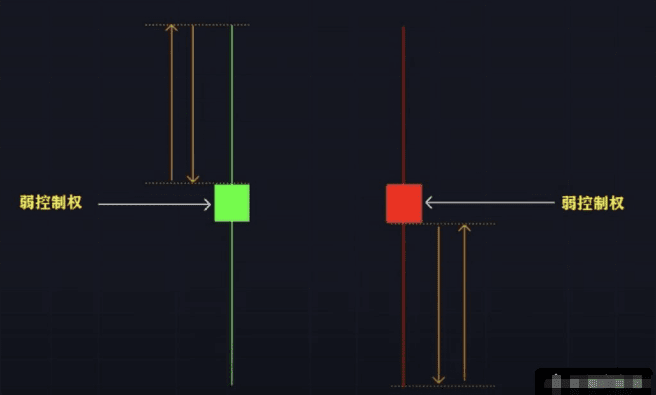
The third yin-yang line
This type of Yin-Yang line entity is actually not short
But there is one place that will greatly reduce our impression of it
This place is the shadow line
Let’s take the Yang line as an example
The price once surged to a high point
But it encountered the opposite force
We see
There is a shadow on the top of this Yang candlestick
The shadow represents rejection
That is, the seller regains some of the lost ground
Compared with the first two kinds of recklessness
We see hesitation and reservation here
The fourth
This type of Yin-Yang line
It is not only physically short
And each has a long lead on the top and bottom
It represents that both sides have launched offensives.
But both sides refused to give in
Both sides do not have the power to break this deadlock to a large extent.
The only way we can tell by color is that the buyer or seller still has a small amount of control
You may think that this type of K-line is very similar to the second one.
But because they end up in different places
So the whole meaning is completely different.
Another major reason is that the shadow line proves that the market has no clear direction for the time being.
We call this kind of Yin-Yang line a cross star
It could be a pause in the trend
Or the market is gathering strength to turn around
Generally speaking, when the market is in a directionless situation
We shouldn't be in.
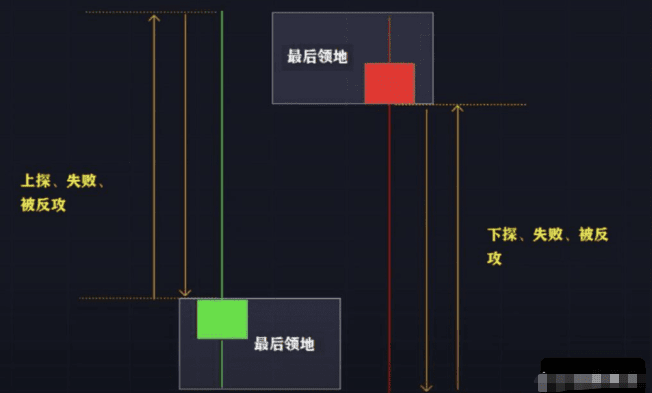
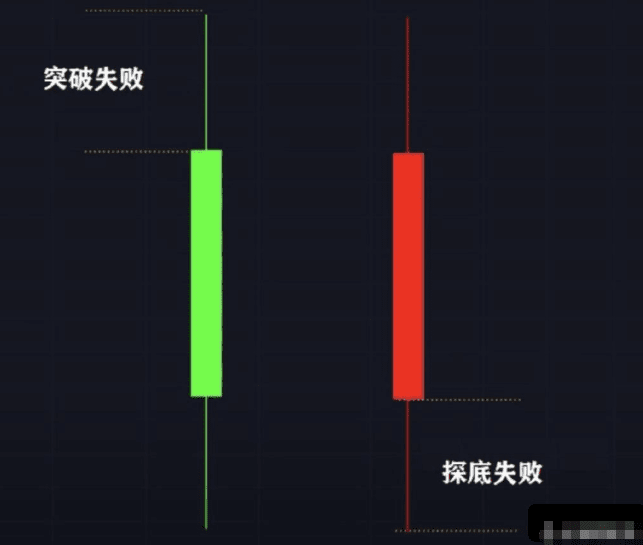
The fifth type
Then comes the weakest Yin-Yang line
We have seen buyers or sellers launch attacks upwards or downwards respectively.
Encountering strong resistance and rejection
Ultimately ended in failure
Once seemed to own the whole world
But unfortunately, the opponent counterattacked
And they are losing ground
At the end of the Yin-Yang line
I can only guard my last remaining territory
The situation is quite dangerous
If you are trading with the trend at this time
You really have to be careful.
See here
I believe you already have a good understanding of the Yin-Yang line.
We finally come to the most important part
That is the third level [K-line pattern]
We have discussed the four parts that make up a Yin-Yang line.
And the meaning behind the 5 different types of strength Yin-Yang lines
Next, based on what we have just learned
Learn something quantifiable
Yin-Yang line patterns that can actually be used for trading
Here I will teach you the 4 most common Yin-Yang line patterns (K-line patterns)
I will use diagrams and examples to explain their definitions.
Formation principles and application methods
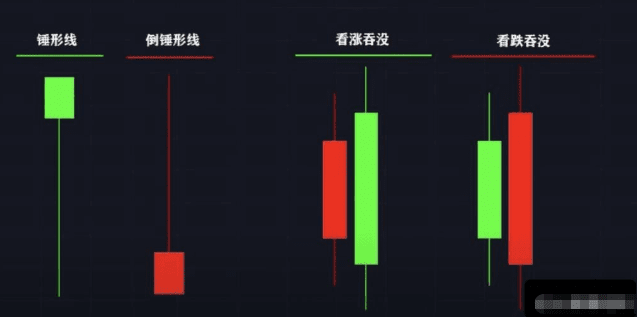
They are
Hammer
Bullish Engulfing
Shooting Star
Bearish Engulfing
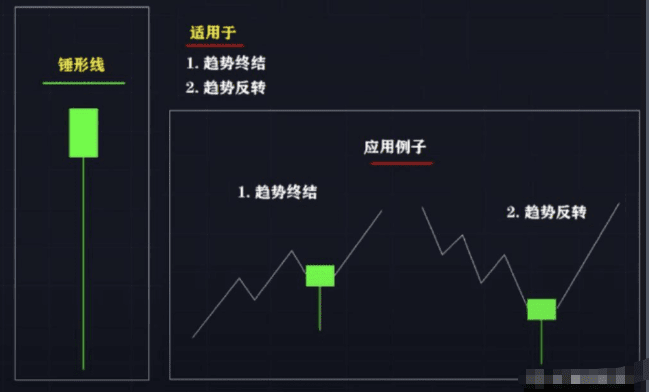
Hammer
Let’s start with the Hammer.
The hammer line is composed of a single Yin-Yang line.
There are three conditions
There is a very small or almost no upper shadow line.
The lower shadow should be at least 2~3 times the length of the body
The price must end above 25% of the entire Yin-Yang line
This form means:
When the Yin-Yang line begins
The sellers launched an offensive and moved downward for a distance
Then the buyers strike back
Even stronger buyer power
Until the Yin-Yang line is completely finished
The buyer managed to recover most of the lost ground
And seized control
This form is a very favorable proof
Buyers begin to participate in the market
This is a favorable Yin-Yang line pattern.
Generally used for trend continuation and reversal
Here is a fallacy:
Many online tutorials say this is just a turning pattern.
Their description is a little bit incorrect.
Let's look at the following two examples
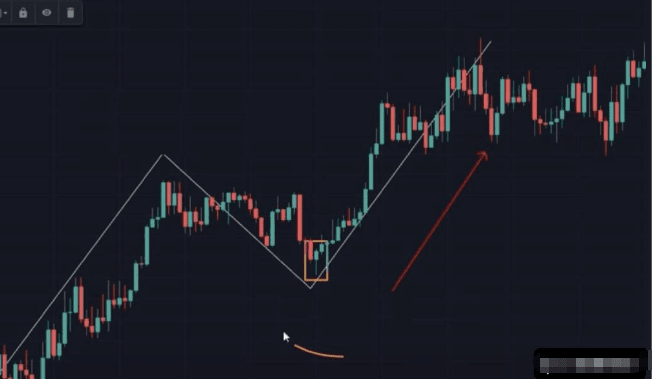
Example 1: Trend Continuation
When we see an upward trend
Then a hammer pattern appeared during the pullback
If we use price to define a trend in this example
This is higher
This is relatively low
We see an inverted hammer pattern at a relatively low point.
Then we can expect the trend to continue
Make a new higher point
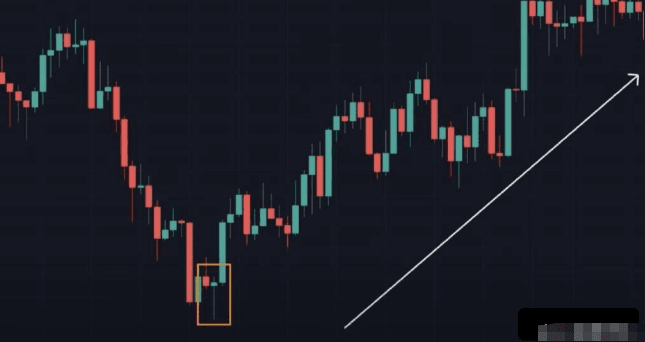
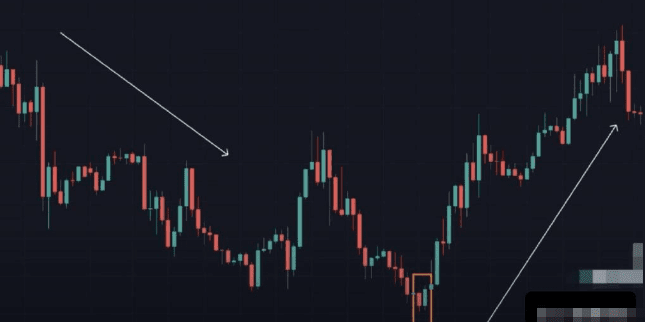
Example 2: Trend Reversal
When a downward trend reaches a certain level
An inverted hammer pattern appears
Suggesting that buyer power is beginning to emerge and take control
Price starts a new trend
Bullish Engulfing
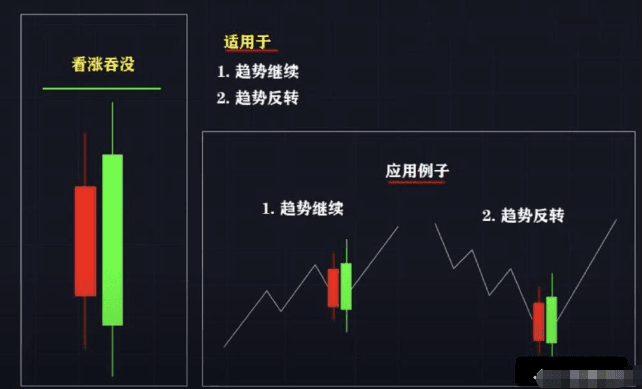
The second example is a bullish engulfing pattern.
A bullish engulfing candlestick pattern is formed by two candlesticks.
We use three conditions to define
Does a bullish engulfing candlestick work?
They are
First: This pattern must be a Yin line followed by a Yang line
Second: The Yang line's body must completely cover the previous Yin line's body
You can ignore the shadow here.
Third: The body of the Yang line cannot be smaller than the body of the Yin line
If the body of the candlestick is too small, we will define it as a doji.
Instead of bullish engulfing
This pattern means that when the price falls to a certain position
A stronger force in the opposite direction emerges
In addition to gaining control
The closing price is higher than the previous opening price
Proof that market sentiment has changed
This is a favorable Yin-Yang line pattern.
The same applies to trend continuation and reversal situations.
Let's look at the following two application examples
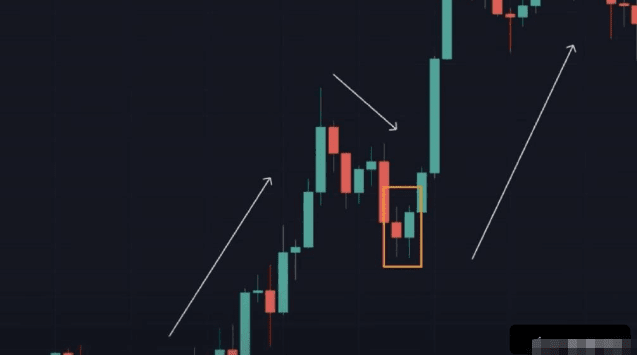
Example 1
Trend continuation scenario
When we see an upward trend
Then a bullish engulfing pattern appeared at the callback position
This is a good sign
Proves that the short-term reverse pullback has ended
The buyer officially returns to take back the home court
Prices continue to rise
Example 2: Trend Reversal
In a downtrend to a certain extent
A bullish breakout pattern has emerged
Buyers find an opportunity to enter the market
Even more powerful than the seller
Reversing prices
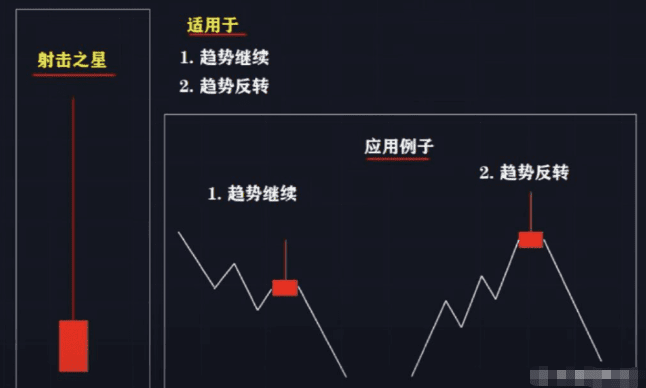
Shooting Star
Next, let's learn two bearish K-line patterns.
The shooting star is actually the same as the hammer line just now.
It's just a change of direction
The Shooting Star is a bearish pattern formed by a single candlestick.
An effective shooting star
There are also three conditions
There is a very small or almost no lower shadow
The upper shadow is at least 2~3 times the length of the body
The price must end below 25% of the entire K-line
The name of the shooting star pattern
In fact, it has reflected its meaning
Shoot an arrow into the sky
I once reached a very high point
Stop when exhausted
Slowly falling back
Forming a very long shadow
This pattern is also applicable in the case of trend continuation and reversal.
You can refer to the example of the hammer line just now.
Turn all the shapes around and you can apply them to the shooting star.
I won’t repeat the examples here.
but
I want to talk about another popular usage
It is a combination of shooting star and moving average.
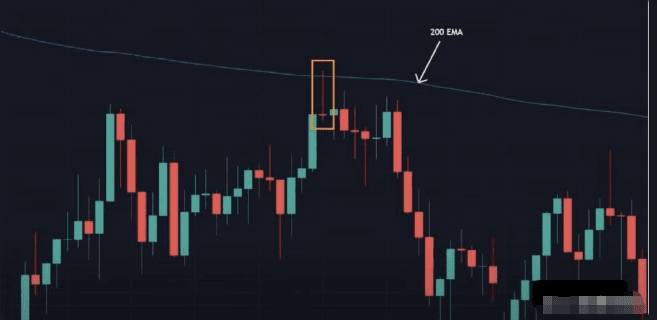
I use a 200 EMA as an example
The moving average is actually the equilibrium point of the market
The most fatal mistake most of us make when using moving averages
It is to make trading signals such as golden cross and dead cross
Because the price and balance point are completely ignored
That is to say, the interaction between moving averages
The correct usage of EMA should be like this
When the price approaches the EMA
Tried to push upwards
We know that the moving average is actually a dynamic support and pressure level.
In disguise
That is, the price tells you through a shooting star:
I once wanted to break this average line and change the long-term trend, but failed, and I no longer have the energy to continue to move upward.
So the price returns to its original trend
Continue down
Bearish Engulfing
The final example is a bearish engulfing candlestick.
A bearish engulfing candlestick pattern is formed by two candlesticks.
I will also use three conditions to define
First: This pattern must be a Yang line followed by a Yin line
Second: The entity of this Yin line must completely cover the entity of the previous Yang line
Third: The entity cannot be too small
This pattern means that after the price rises to a certain position
Suddenly, a stronger force in the opposite direction appeared.
Like a car braking suddenly
Turn around and leave immediately
This pattern also applies to trend continuation and reversal examples.
Just like the bullish engulfing
Turn it upside down.
I won't repeat it here.
I will use major support and resistance levels in conjunction with the bearish engulfing candlestick pattern.
Make a trading example
If you don’t know what the main support and resistance levels are
Don’t know how to identify and find the main support and resistance levels
You can check out the articles I wrote before
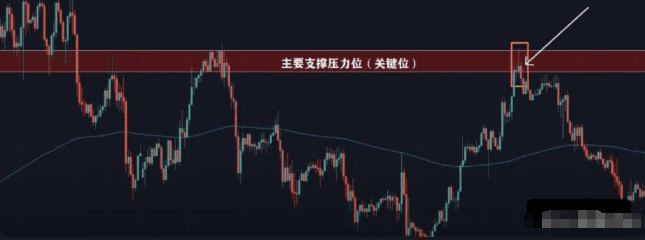
We see here
This is a major support and resistance level
I won't explain in detail.
But at this position, combined with the bearish engulfing candlestick pattern
Its winning rate is very high
We see that after the price goes to the main support and resistance level
The next entity immediately appears with a force in the opposite direction
And this force is more powerful than the seller
Finally, a bearish engulfing pattern formed.
It fully meets the conditions for us to define this form as valid.
After a Yang line
Then a Yinxian
The body of the Yin line
Completely covers the body of the Yang candlestick
And the entities are also of sufficient length
Prove its determination to change the trend
Prices are naturally going down
So, the course about K-line
That’s all we have to say today
I said
The trading market is the fastest way to monetize technology
As long as you learn the technology
You can cash out immediately
No marketing required
No need to rent a house
No need to purchase
No activities required
No need to recruit
......
You don't even need to buy a computer.
You can make a fortune in silence
The kind with no upper limit
But making money has never been easy
If you only learn half a barrel of oil
Hurry into the scene
That would be a loss of both the wife and the army.
Trading is not gambling!
The only enemy on the road of cryptocurrency speculation is yourself
Investing is a highly entrenched industry. While all you need to enter the CEX cryptocurrency trading market is a phone/computer, a phone number, and an ID card, that doesn't guarantee you'll make money. Ultimately, the cryptocurrency market is a human one, where greed, anger, ignorance, arrogance, and doubt are all fully manifested.
01 Regarding gambling and altcoins: Playing with altcoins is gambling, holding onto Bitcoin is the right path. This is a rather bizarre argument in the current market. Regularly investing in Bitcoin is also highly recommended by many bigwigs, but none of these bigwigs' early fortunes were separated from altcoins, even CX coins.
I heard a big shot advocating for regular investment in Bitcoin, and then I started to do so without knowing why. Isn’t this gambling?
Whether or not it's gambling has nothing to do with the currency. The fundamental gambler's mentality lies in ignoring current trends and acting based on greed, fear, and hope. For many, the cryptocurrency world is simply a casino, and many in the A-share market also consider it a casino.
Those who view the market and the cryptocurrency world with this kind of mentality don't need to stay here. Wouldn't it be better to go to Macau and have some fun? Viewing the market with a gambling eye will inevitably lead to disastrous consequences. The moment someone enters the market with a gambler's mindset (the cause), they are drawn into the web of karma, and a tragic outcome (the result) is already predetermined. No matter how they act, it's a gamble of their lives.
Back to Bitcoin and altcoins. Some people always belittle the altcoin community as worthless. Without Ethereum, a forerunner of Bitcoin, would Bitcoin have achieved its current success? As a pioneer, Bitcoin and subsequent altcoins enjoy a symbiotic and complementary relationship, not competition. Bitcoin alone cannot fully unlock the potential of blockchain; altcoins are needed to extend and expand it. In comparison, for the average investor, high-quality altcoins are a better choice because they offer relatively higher returns.
But there is a basic fact: in the long run, altcoins that can outperform Bitcoin are rare. Of course, in any market and at any time, only a small number of people can become legends.
02 About contracts and technical analysis Just like altcoins, contracts are also a scourge, and futures contracts are basically equivalent to casinos in the cryptocurrency world.
I had never been exposed to contracts before. People often thought that playing with contracts was like giving away money, with numerous reports of people losing everything. There was a huge misunderstanding about contracts. It wasn't until I started playing with them earlier this year that I realized they were a valuable tool.
The main criticism of contracts is the risk of margin calls, which simply depends on the individual. I only invest a small portion of my total capital in contracts, which I then divide into 10 equal parts. I always set a stop-loss for each trade. While I haven't won much, I've played hundreds of times and haven't been wiped out. Most people trade without a set trading system. For example, if a market reversal occurs, they don't have any stop-loss mechanisms. Instead, they imagine a reversal is imminent, and if they don't, then who will?
As a tool, a contract itself is neither good nor bad; it all depends on the user.
Because I'm involved in contracts, I've been exposed to technical analysis. Like everyone else, I used to think technical analysis was bullshit, a form of hindsight. It wasn't until I started using it myself that I realized it wasn't true. Technical analysis isn't about making predictions; that's just shady business.
The essence of technical analysis: Technical analysis is essentially a translator. Numerous factors influence market prices, and you don't know which one carries the most weight. However, all factors ultimately lead to a single outcome: price. Technical analysis uses price to describe market activity. This is its value; it speaks a language humans can understand.
The biggest change that technical analysis has brought to me is that I know how to avoid risks. For example, I recently bought an IEO
The cryptocurrency saw a nearly 800% increase. In the past, I would have either sold out midway due to fear of over-performance, missing out on significant profits, or held on to it after reaching its peak, leaving me trapped. Now, the cryptocurrency has lost half its value. This time, using a simple long- and short-term moving average system, I discovered that the cryptocurrency had shifted from a bullish to a bearish market on the macroeconomic chart, posing a significant downside risk. I sold out promptly and preserved the majority of my profits.
People are easily influenced by external voices and reject or like something they have never understood. This is a disease and must be changed.
03 On Greed and Fear: Rejoice in material gains, grieve over self-destruction. Rising prices are revolutionary, falling prices are deceptive. Emotions are always the biggest obstacle in your investment journey, disrupting all your plans. Many people actually have trading plans, selling at the predicted selling point and buying at the predicted buying point. However, when emotions enter the picture, the results are often the opposite of what you'd expect.
For example, the 312 crash. Many people said that their trading systems had already given sell signals before 312, but because the market was enthusiastic about and had endless expectations for the Bitcoin halving at the time, they did not want to miss out on the halving market, and greed took over everything. 312 was the biggest retribution, and endless joy and expectations turned into endless sadness.
No trend is worth fearing or being surprised by. If you still feel fear or surprise about any trend, it means that you are still controlled by your emotions. You should continue to hone yourself in the current trend and let all fear and surprise disappear.
How to eliminate greed and fear? The most common way is to be constantly baptized in the market. Here I have a better convenient method - the Zen koan.
I'm a bit of a Zen enthusiast, meditating daily on koans. While contemplating the koan "Who is reciting the Buddha's name?", I wonder who is actually reciting the Buddha's name. This is koan contemplation, and it can be applied to any thought, such as "Who is sparking greed?" If you follow up, you'll quickly question where this thought originates. At this point, greed is already gone.
The same goes for "Who is afraid", "Who is happy", etc.
04 In summary, people are easily disturbed by the outside world. Cognitively, they will inexplicably reject or like something they have never understood. Emotionally, they are prone to discrimination towards the fluctuations of the K-line. However, the true voice of the market is always the present.
Investing is a lot like spiritual practice; each uses its own method to sharpen your mind and dispel layers of obscurity to grasp the true meaning. Investing is a spiritual practice, and on that journey, your only enemy is yourself.
I am Axin and only do real trading. The team still has positions to move up.


