The market trends of ETH and BTC exhibit typical technical characteristics of 'surge and fall, entering a consolidation phase'. Currently, both major cryptocurrencies are at critical technical positions, with market bullish and bearish forces locked in a stalemate, making the subsequent direction choice worth close attention.
1. Overall Trend Review: After the Passion Comes Calm
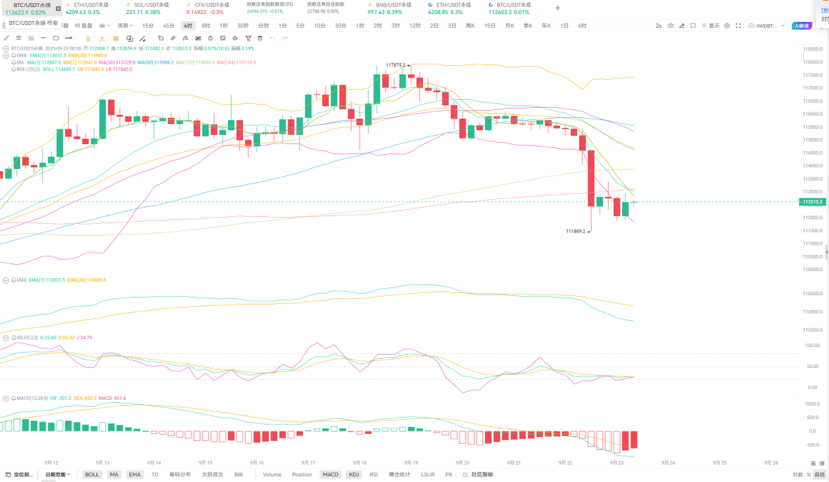
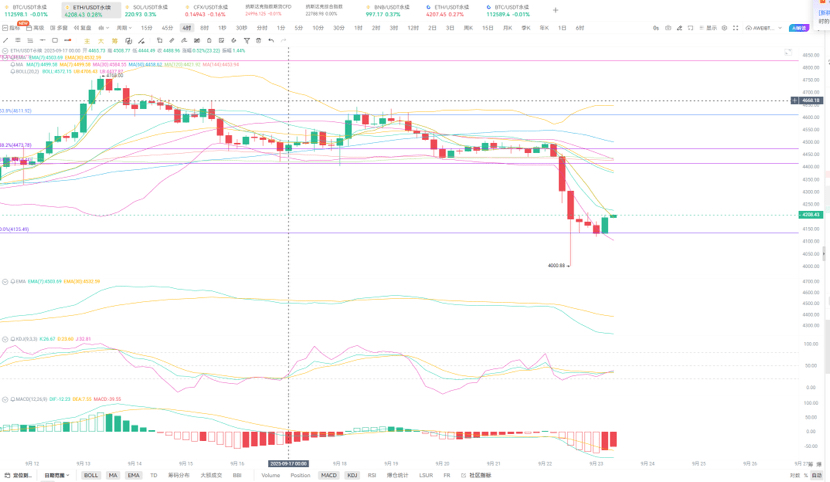
The chart clearly shows that the market experienced a significant fluctuation in mid to late September. The price of BTC once surged to a high of 117875 but failed to hold, quickly retracting to a low of 111469, with a fluctuation of over 5%. The ETH trend was highly correlated, also facing selling pressure after reaching a peak, and experiencing a sharp drop around September 17, hitting a low of 4000.
This wave of correction has effectively released the profit-taking pressure accumulated from the previous rise, bringing the price back from the overbought zone to a relatively neutral level. Currently, both prices are positioned in the lower half of their recent fluctuation range, entering a brief phase of balance and consolidation.
II. Technical Indicator Analysis: Bullish and Bearish Signals Interwoven
The rich technical indicators in the chart provide us with multiple dimensions to gauge market sentiment:
1. Moving Averages (MA/EMA): For BTC, the short-term EMA(7) is around 113031, while the long-term MA(30) is at 115329. The current price (around 112600) is operating below all major short-term moving averages, but has not deviated significantly, indicating that the short-term trend has shifted from bullish to bearish, but the long-term trend has not yet been broken, and the market is at a critical juncture of reselecting direction. ETH's situation is similar, with prices hovering near several moving averages.
2. Bollinger Bands (BOLL): The middle band of BTC's Bollinger Bands (BOLL:114643) is currently the nearest resistance level above. The price is currently running between the middle band and the lower band, and there are signs of a narrowing Bollinger Band width, which usually indicates a decrease in volatility, suggesting that a new trend may be brewing. The next breakout direction of the price will become a key signal.
3. MACD Indicator: This indicator consists of the fast and slow lines and the histogram. From the chart description, the MACD curve fluctuates above and below the zero line, with the histogram showing alternating red and green. This typically means that market momentum is insufficient, and both bulls and bears are evenly matched, resulting in a lack of a clear one-sided trend in the short term, consistent with the current range-bound pattern.
4. KDJ Indicator: The three curves of KDJ in the chart are intertwined, indicating that the market is in a consolidation phase, with no extreme overbought or oversold signals appearing, as investors await new catalysts to break the balance.
III. Key Positions and Market Outlook
In summary, the market is currently in a period of 'consolidation and waiting for change.'
Our main strategy recently remains focused on short positions, with short-term resistance at 113500 for BTC, while ETH focuses on the integer level of 4300. BTC can set up short positions at this level, and ETH can be positioned around 4260-4280.
The current sentiment in the cryptocurrency market is cautious, with technical indicators showing fierce competition between bulls and bears near key price levels. For traders, it is advisable to remain patient and avoid blindly chasing highs and cutting losses until the direction is clear. Close attention should be paid to changes in trading volume: any directional breakout requires a significant increase in trading volume to confirm its validity. Additionally, global macroeconomic dynamics and regulatory news should be closely monitored, as these external factors may very well become the final catalyst to break the current technical stalemate. Prudent investors may wait for the price to effectively break through key resistance or support before following the trend.