

Bitcoin is down 4.5% from last week's high as the crypto industry becomes less risky.
Ethereum has fallen below the 50-day EMA, which makes it more likely that it will fall further more below the $4,000 mark.
XRP's drop below $3.00 continues as sellers look for support around the 200-day EMA.
Bitcoin (BTC) begins the new week on the wrong foot as those who don't want to take risks sell up their cryptocurrencies. With the recent rise in volatility, BTC stays down to little over $112,000 at the time of writing on Monday.
Most altcoins, including Ethereum (ETH) and Ripple (XRP), are down, and the biggest smart contracts token, ETH, has dropped below $4,200. XRP, on the other hand, has dropped a lot below the important $3.00 mark, as supply continues to outstrip demand.
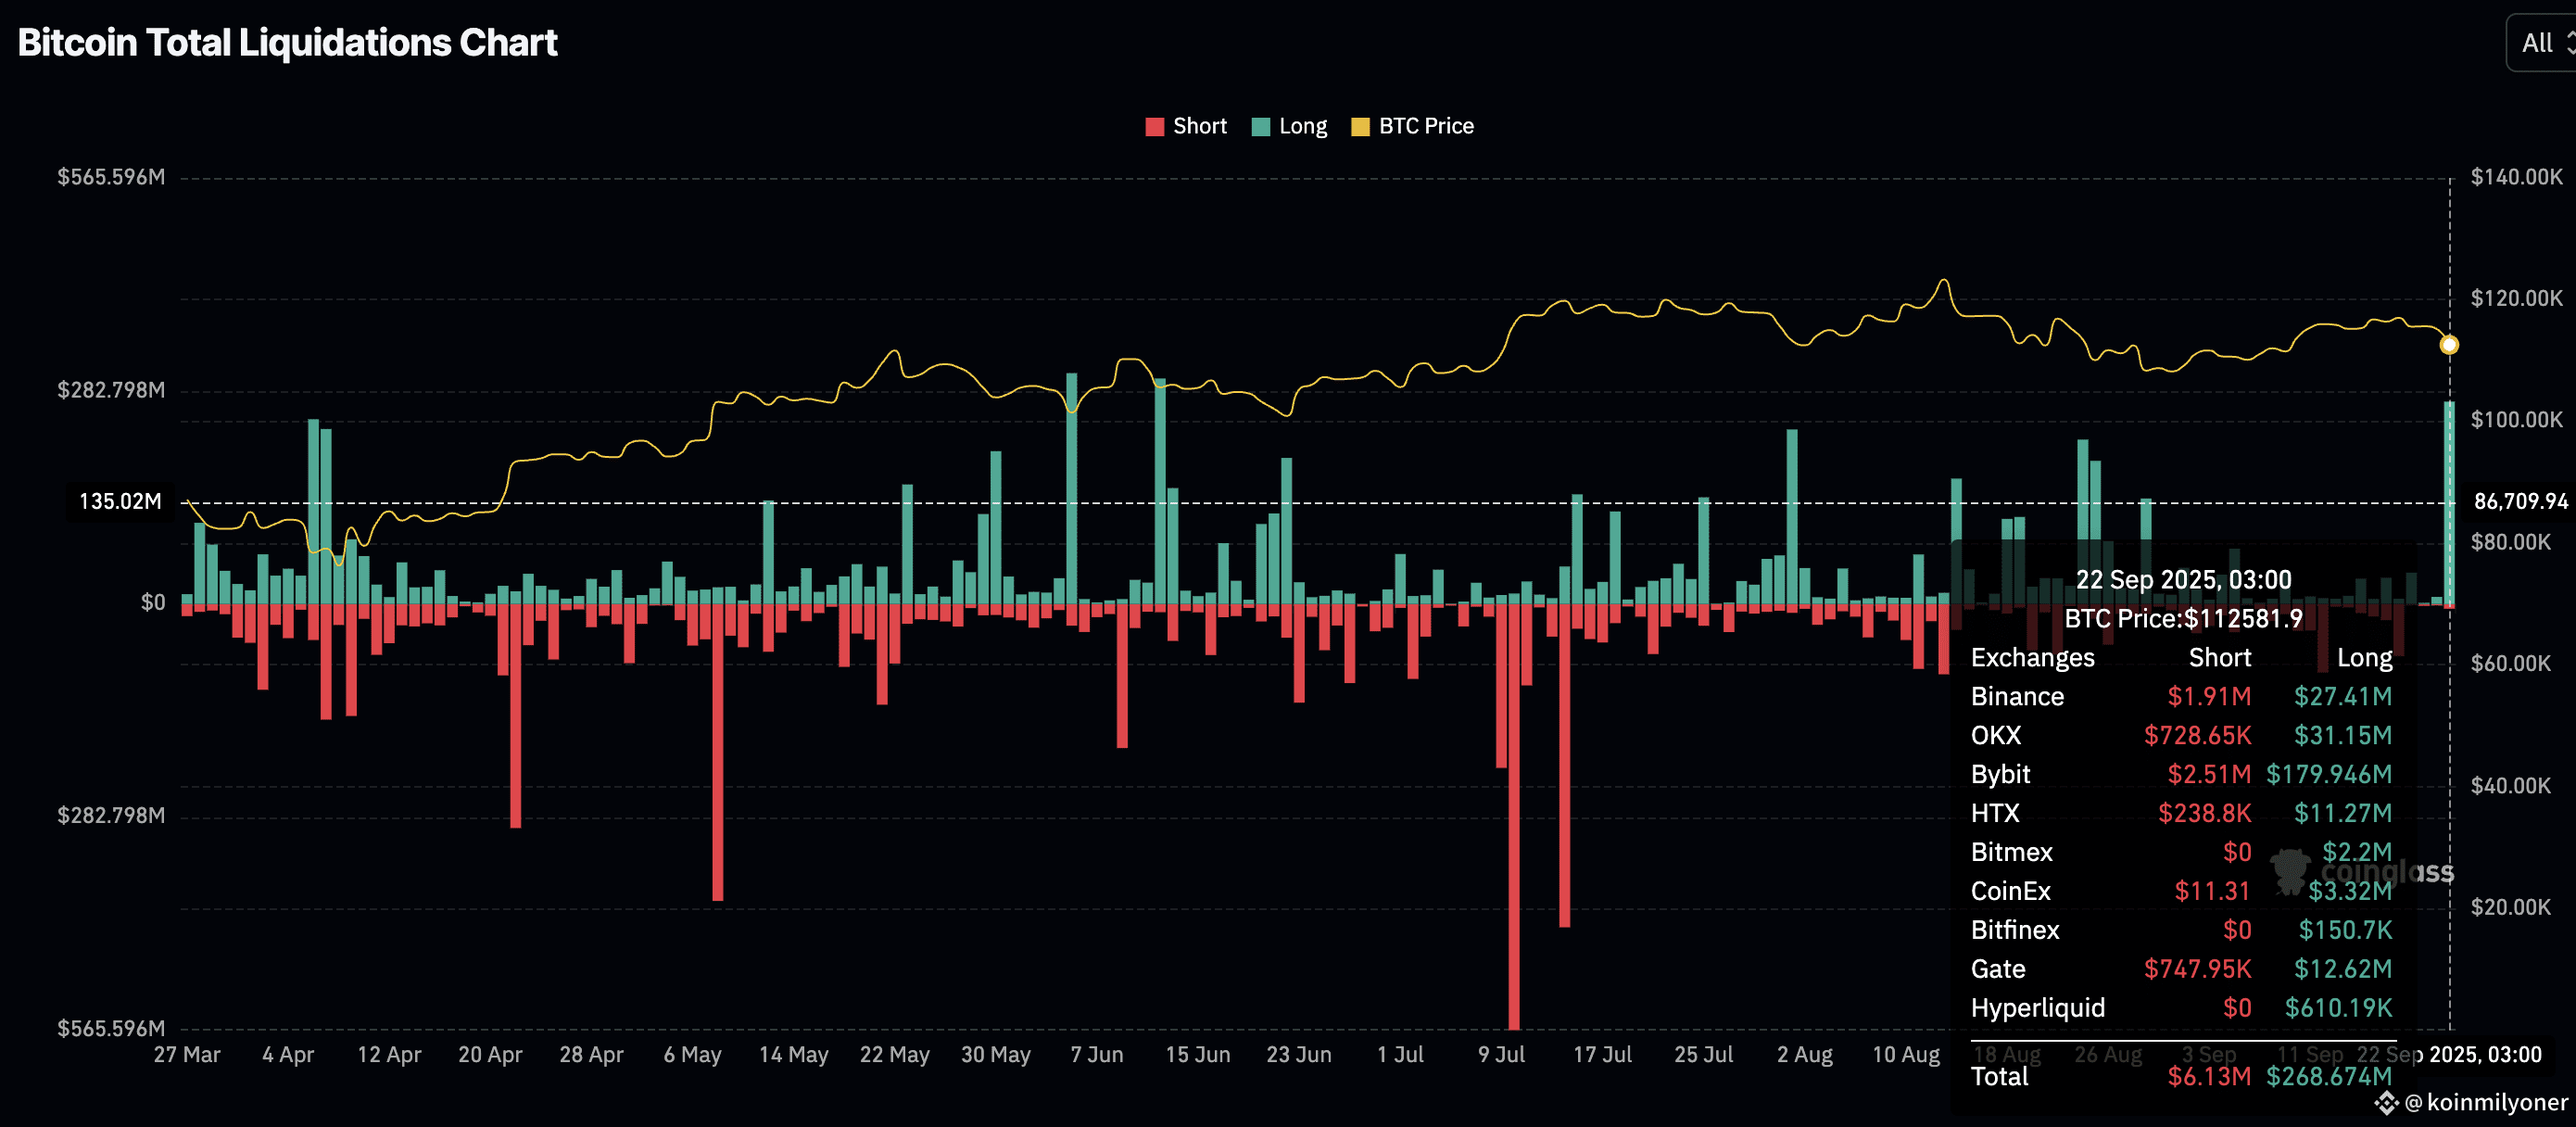
Data spotlight: Bitcoin leads the way as crypto liquidations rise sharply
Many leveraged traders are losing money as the bitcoin market sells down broadly and volatility rises. CoinGlass says that in the last 24 hours, there had been $1.7 billion in total liquidations, with long holdings making up $1.61 billion of it. The other liquidations, which totaled around $84 million, hurt those who had short positions.
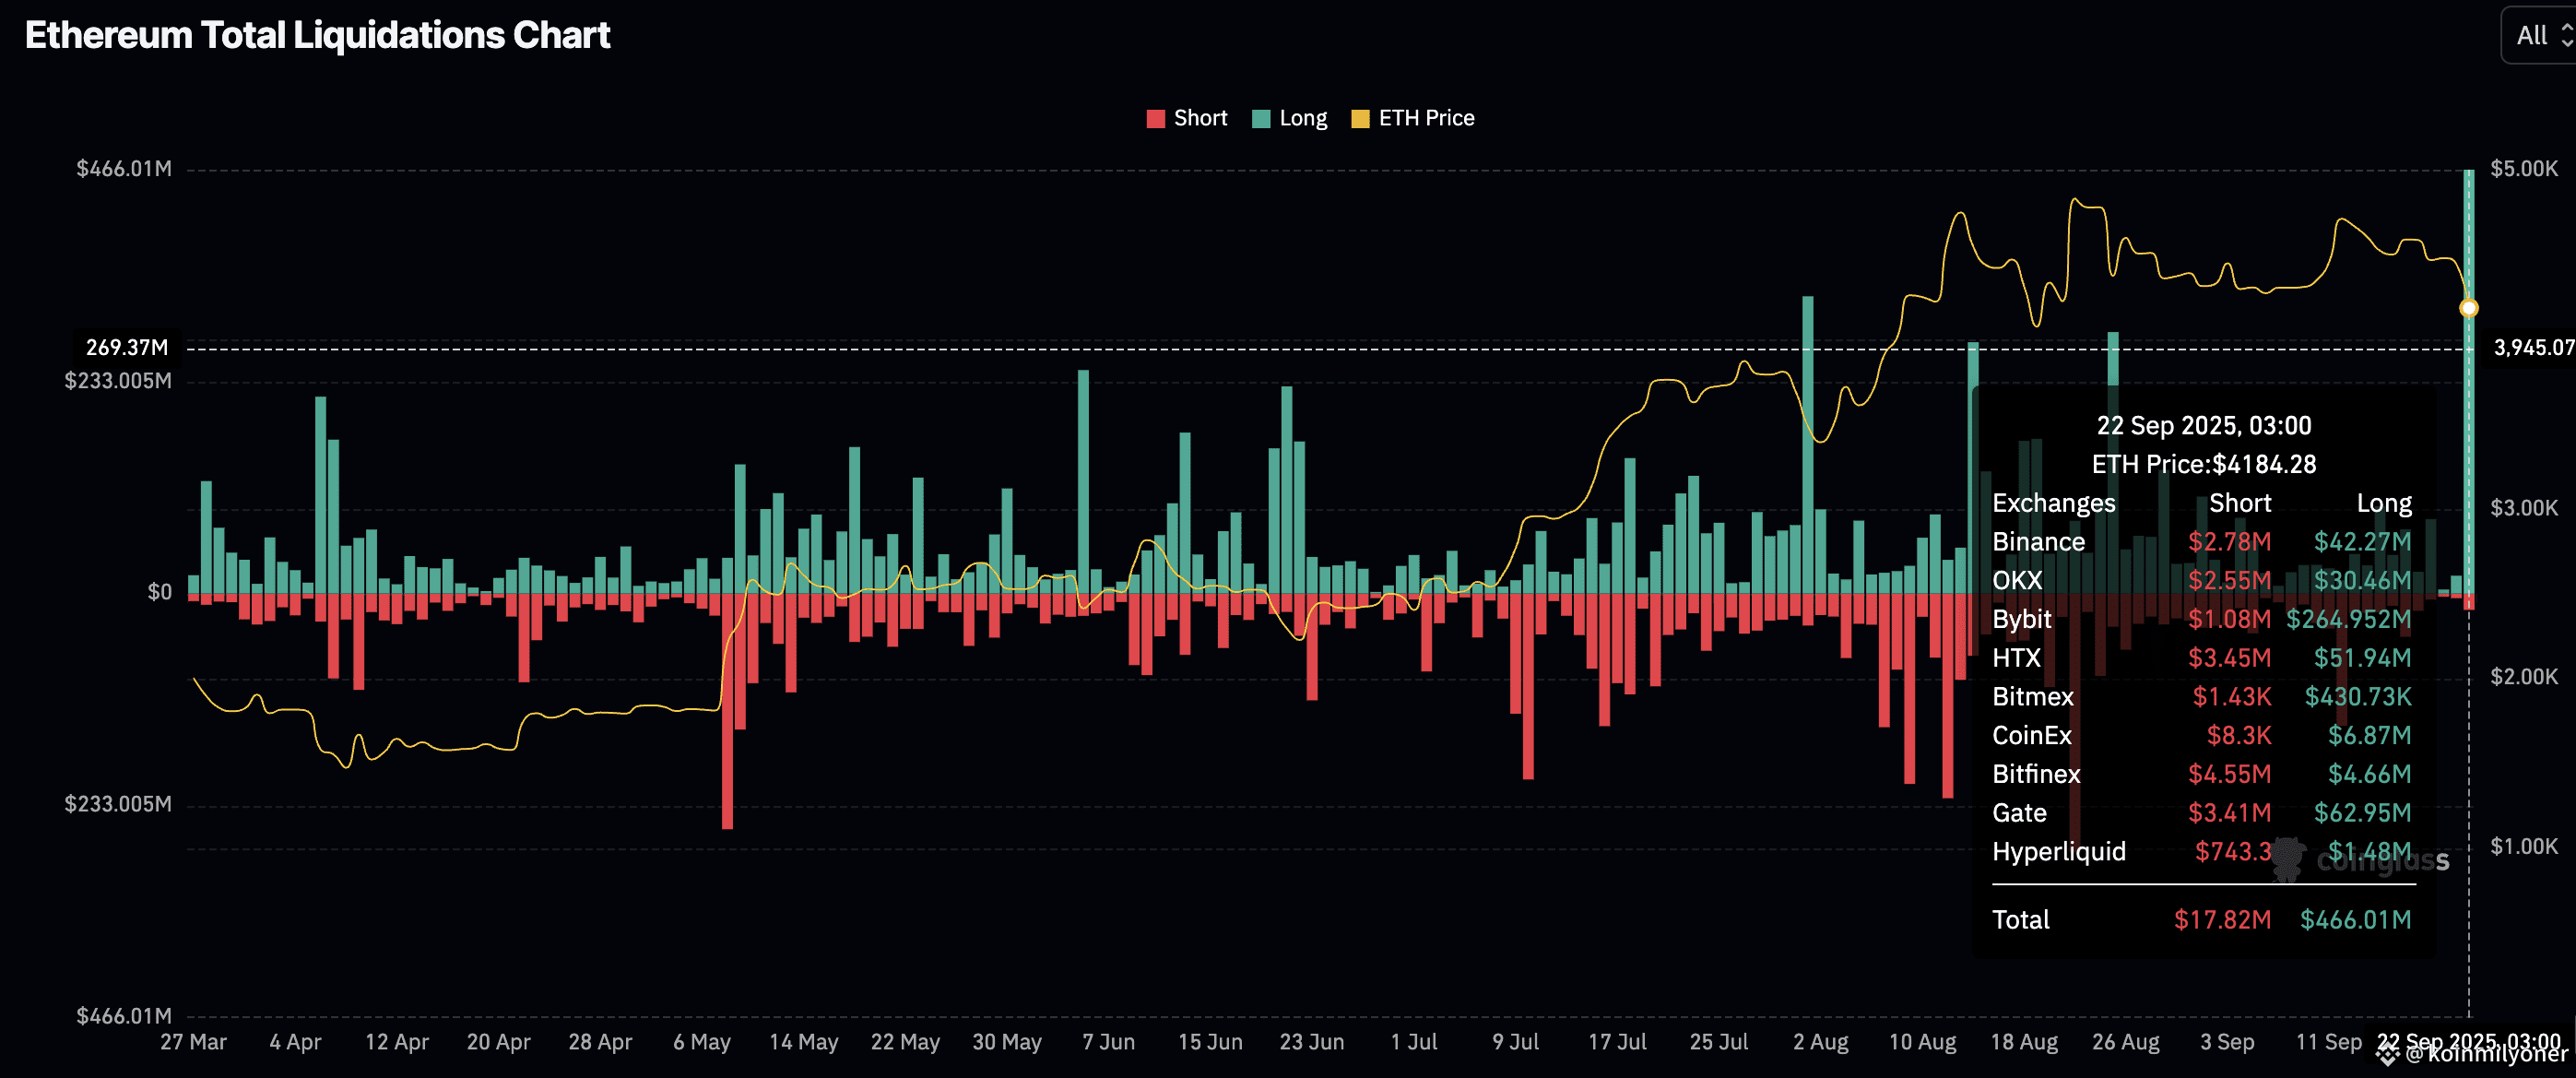
Ethereum traders had the most liquidations, with long holdings worth $466 million and short positions worth around $18 million. Interest in Ethereum has gone up in the last week. Its technical outlook showed that people were feeling confident about its record high of $4,956. As liquidations rise, people may start to pay more attention to lower support levels, like $4,000.
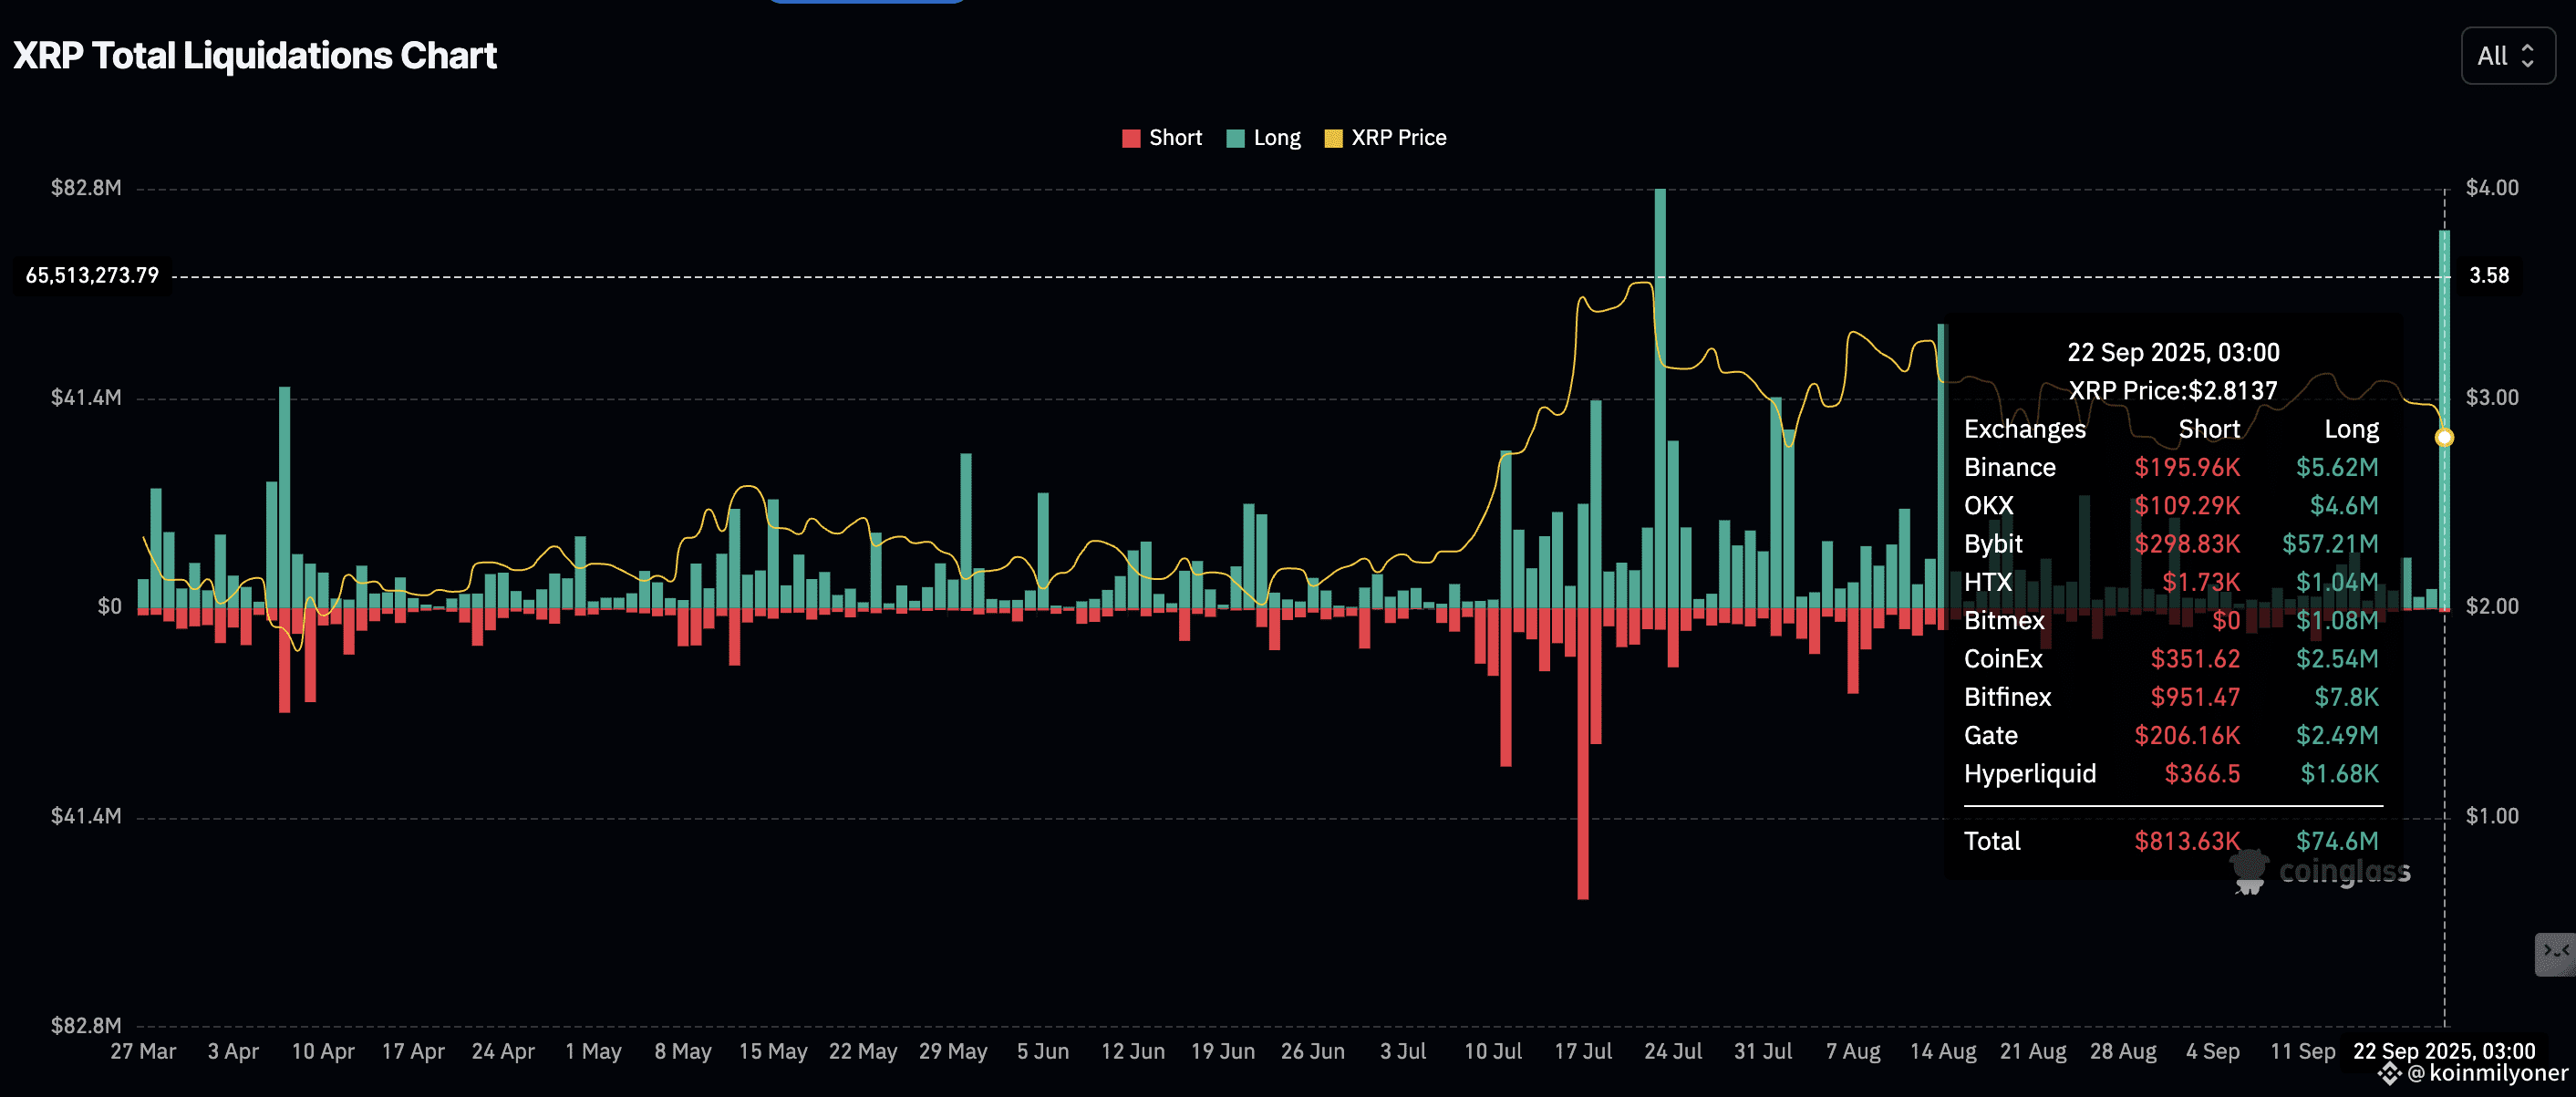
XRP traders also had to deal with the pain, as liquidations rose to over $74 million in long holdings and $814,000 in shorts. XRP is weak after falling below the important $3.00 mark. Right now, the risks are pointing to lower demand levels, like $2.50.
How far may Bitcoin go down? This is the chart of the day.
around the time of writing on Monday, Bitcoin is trading just over $112,000, with the 100-day Exponential Moving Average (EMA) acting as support around $111,846.
The Relative Strength Index (RSI) on the daily chart dropped sharply from last week's high of 61 to 43, which shows that the sell-off is still continuing on. The RSI dropping into oversold area will mean that bullish momentum is waning, which will make it more likely that BTC will fall below the $110,000 round-figure support.
The 100-day EMA at $111,846 is the only real support level. The 200-day EMA at $105,965 and the demand level at $107,304, which was challenged on September 1, are also important.
Update on altcoins: Ethereum and XRP are showing signs of going down.
Ethereum is trading below the 50-day EMA, which has become resistance around $4,252 as of this writing. In the meanwhile, important technical indicators show that the down trend might go longer, and the price of ETH is likely to test the round-number support at $4,000 again.
If the larger risk-off trend continues this week, traders may pay more attention to the 100-day EMA at $3,832 and the 200-day EMA at $3,369. For now, it seems like the easiest way to go is down, unless investors purchase the dip and Ethereum regains the 50-day EMA support around $4,252.
Sellers are back in charge of the XRP trend, which is speeding up falls below the important $3.00 barrier. The cross-border money remittance token currency is below the 50-day EMA at $2.95 and the 100-day EMA at $2.83, which acted as support last week.
The next possible support level is $2.70, which was challenged by a candle wick earlier in the day, and the 200-day EMA at $2.59. This is if the down trend goes much lower than the 100-day EMA. Still, a reversal over $3.00 is possible, particularly if traders purchase the dip, which would help the price go back up.


