---
🚨 XRP/USDT – Traders’ Technical Eye View (4H Chart Analysis) 🚨
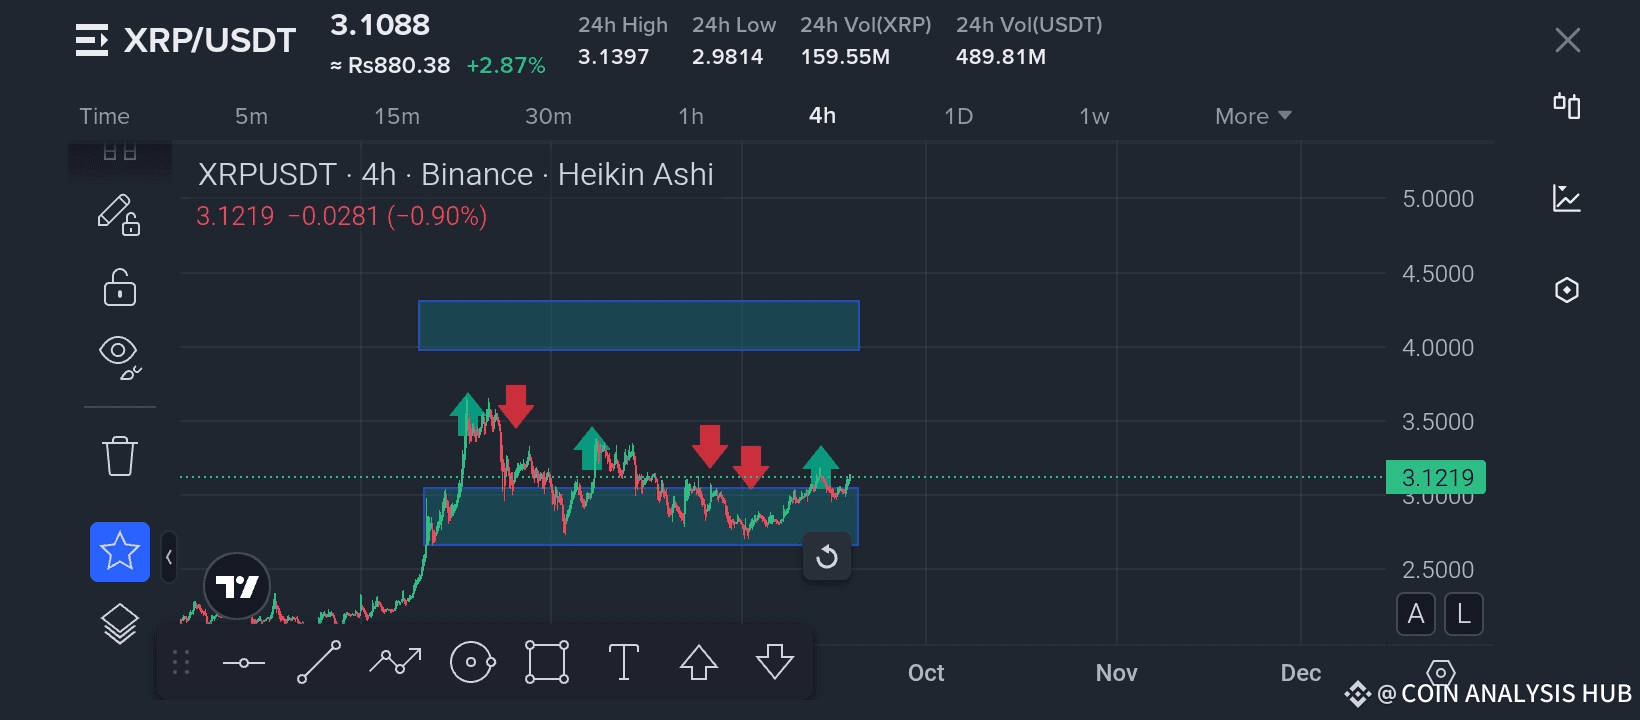
📊 Currently, XRP is trading around 3.12 USDT, showing steady movement after a period of consolidation. On the 4H Heikin Ashi chart, we can clearly observe some interesting technical setups forming that every trader should keep an eye on.
🔎 Key Observations:
1️⃣ Support Zone (Green Box): XRP has been respecting the demand zone around 2.95 – 3.05 USDT, bouncing multiple times, indicating strong buying interest at these levels.
2️⃣ Resistance Zone (Blue Box): The supply zone around 3.40 – 3.60 USDT has acted as a tough ceiling. Price has failed to break it decisively in recent attempts.
3️⃣ Pattern Formation: After several rejections (marked with red arrows), XRP has started showing bullish attempts (green arrows), suggesting accumulation at lower levels. If momentum continues, a breakout towards the resistance box is possible.
4️⃣ Volume Insight: Noticeable spikes in trading volume on upward moves signal that smart money may be preparing for a push.
📈 Traders’ Eye View:
If XRP holds above 3.00 USDT, chances are high for a retest of the 3.40 – 3.60 USDT resistance zone.
A clean breakout above 3.60 USDT could open the doors for a rally towards 4.00+ USDT levels.
However, if it slips below 2.95 USDT, caution is needed as deeper corrections could follow.
💡 Pro Trader Tip: Always wait for confirmation candles on higher timeframes before entering positions. Chasing pumps without confirmation often leads to losses.
---
🔥 If you found this analysis useful, don’t forget to LIKE ❤️, COMMENT 💬, and FOLLOW 🔔 for more real-time, trader’s-eye technical updates. The more support this post gets, the more motivation I have to share exclusive chart breakdowns with you daily! 🚀
