🚀 IMX/USDT Market Update – Trader’s Eye View 👀💹
Hello Traders! 🌍🔥
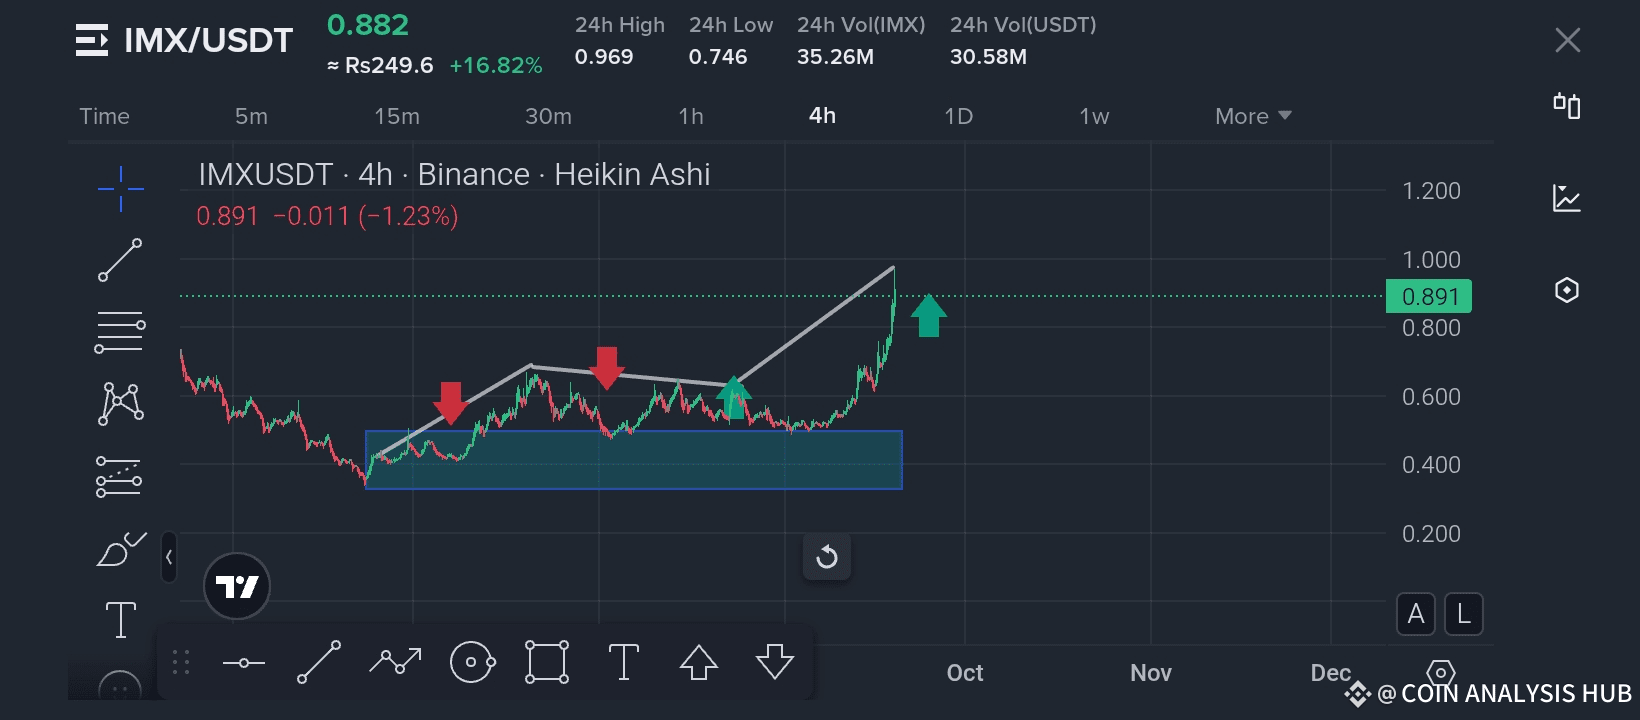
Today we are looking closely at IMX/USDT (ImmutableX) on the 4H Heikin Ashi chart, and the current setup is showing us some powerful signals worth our attention. Let’s break it down step by step with a trader’s perspective. 📊✨
---
🔎 Current Market Situation
At the moment, IMX is trading around 0.88 – 0.89 USDT, after a sharp and healthy breakout from the accumulation zone 📈. The market had been consolidating inside a blue box (demand/support zone) for quite some time. This long sideways phase acted as a base-building period, where smart money was quietly accumulating before the breakout. 🏦🧠
During this consolidation, we observed multiple rejections from the upper resistance line (marked by the red arrows ⬇️). Each rejection represented short-term sellers stepping in. However, notice how the buyers never allowed the price to fall below the main support zone. That was a strong clue of bullish accumulation. ✅
Finally, the green arrow ⬆️ breakout candle came into play, breaking the trendline resistance and pushing IMX into a new bullish wave. Right now, momentum is clearly in favor of the bulls 🐂, and the price action is trending upward toward the next key levels.
---
📈 Technical Outlook
1. Resistance Levels:
The next major psychological resistance is 1.00 USDT, followed by 1.20 USDT if momentum continues. These levels will likely attract profit-taking from early buyers.
2. Support Levels:
The immediate support sits near 0.80 – 0.82 USDT, which was the breakout zone.
A deeper support lies around 0.74 – 0.76 USDT, but only a strong bearish reversal would bring price back there.
3. Trend Structure:
The breakout pattern resembles a rounded bottom formation, which often signals the end of a downtrend and the start of a new bullish cycle.
As long as IMX holds above 0.82 USDT, we can expect higher highs and higher lows to form in the coming sessions.
---
🔥 Trader’s Eye Analysis
The market has shifted from distribution → accumulation → breakout → expansion.
Momentum is with buyers, and volume is confirming the strength of this move. 📊
Traders entering at lower levels are already sitting in profits, but the move doesn’t look exhausted yet.
If you’re a swing trader, you might look for entries on retests near support zones, riding the trend toward the 1.00 USDT level.
If you’re a short-term trader, keep your eyes on quick pullbacks for intraday scalps, but don’t chase at the very top 🚨.
---
💡 Pro Trading Tip
👉 Always remember: “Markets move in waves.” After every breakout, expect small pullbacks. Don’t panic on minor corrections – they’re often healthy signs before the next leg up. 📉➡️📈
Set your stop-loss wisely below support zones and never risk more than you can afford to lose. Protecting capital is just as important as making profits! 💯
---
🎯 Final Thoughts
IMX is showing strong bullish energy right now, and traders’ eyes should remain on the 1.00 psychological mark. If the bulls manage to break and hold above that zone, we may see even stronger rallies ahead.
The chart is giving us a clear lesson: patience during accumulation pays off when breakout arrives. Those who spotted the bottom are enjoying the gains, and latecomers still have opportunities on smart pullbacks. 🚀💸
---
💬 Do you like my analysis?
If yes, drop a 👍, share this post with your friends, and don’t forget to follow my channel for more professional trader’s eye market updates. 🔔👥
✨ The more you support with likes, shares, and follows, the more powerful insights I’ll keep bringing for you. Let’s grow together in this trading journey! 🌟📊
#Crypto #IMX #Trading #USDT #MarketUpdate #Trader’sEye
Best of luck 🤞 🍀 🤞