I have been trading for 10 years, cried for 4 years, and laughed for 6 years. Especially in the first 3 years, I took many unnecessary detours. The thing I regret the most at that time is that I seriously overlooked the basics of trading! Today, I spent 4 hours organizing some commonly used treasured trading guides to share with fellow cryptocurrency enthusiasts. I hope to help everyone quickly solidify their foundation and make continuous progress!
For newcomers to the cryptocurrency world, mastering some practical trading techniques is crucial. Here are the insights shared by a trading winner worth over a billion.
1. Select strong cryptocurrencies, using the 60-day moving average as guidance.
When trading cryptocurrencies, focus on those strong-performing coins. If you are unsure, observe the 60-day moving average. When the price is above the 60-day moving average, it is a good time to consider buying or adding to your position; once the price falls below the 60-day moving average, you should decisively exit. This strategy is effective in most cases.
2. Enter at low levels, avoid chasing highs.
When encountering cryptocurrencies that suddenly rise more than 50% overnight, do not rush to chase the high, as this can easily lead to anxiety. Instead, you should choose to enter at low levels, as this carries relatively lower risk, while the potential returns may be greater.
3. Capture signals before a big rise
Before a significant rise in cryptocurrency prices, there are usually some signals. For example, the price may fluctuate within a relatively narrow range, possibly between 10% and 20%, while the trading volume significantly decreases. At this time, you can slowly buy in at low levels, and you are likely to catch the upcoming upward train.
4. Keep up with new market hotspots
Whenever a new market hotspot appears, the first few days are often very explosive. This is a good time to seize profitable opportunities. You can follow the flow of large funds to easily achieve profits.
5. Stay calm during bear markets
Once entering a bear market, you need to control your hands and avoid rash actions for at least six months. In a poor market, reduce trading and learn to rest. True experts know how to rest at the right time.
6. Regularly review and adjust strategies.
You should review your trading records every week, but focus not on how much money you made, but whether your trading strategy is correct. If the strategy is correct, stick to it; if the strategy is wrong, adjust it in time. After a few months, your cryptocurrency trading journey will become more and more stable.
Today's focus is coming: a trading method that is both simple and very effective for trading cryptocurrencies - the MACD strategy.
1. Explanation of MACD indicator
1. Concept definition
MACD (Moving Average Convergence Divergence) describes the relationship between two moving averages, consisting of a fast line and a slow line. Its main function is to determine and predict changes or continuations in price trends.
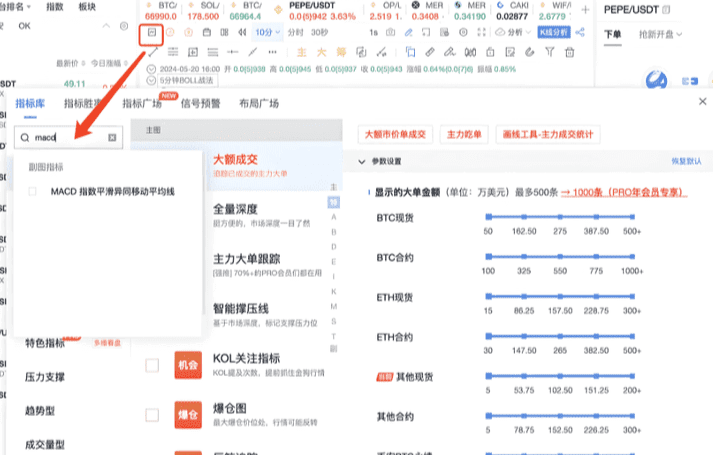
2. How to enable MACD indicator
Open the indicator library, search for the MACD indicator and check it, the MACD indicator will show below. For example, in the BTC/USDT trading on Binance, when the price is 66997.99, switch to the BTC 1-hour chart, set MACD's call 1 to spot. In the original settings, the short period (N1) is 12, long period (N2) is 26, DEA period (M) is 9, and you can use the original settings without making too many changes.#币安HODLer空投TREE
3. Green line and orange line
1. Green line (DIF, fast line): is the difference between the short period (12 periods) EMA and the long period (26 periods) EMA; it responds sensitively to market changes, reflecting changes over a shorter time span.
2. Orange line (DEA, slow line): is the 9-period EMA of DIF, relatively smooth, reflecting market changes over a longer time span and is more lagging compared to the fast line.
3. MACD energy bars: show the difference between DIF and DEA. Through the green line, orange line, and energy bars, you can judge market trends and momentum changes.
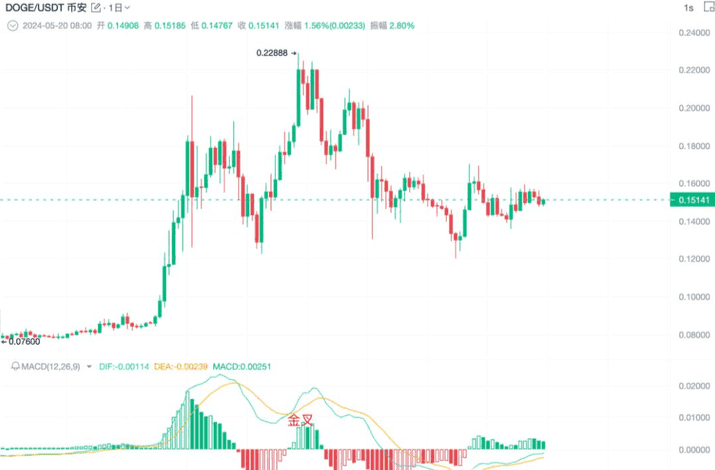
2. MACD golden cross and death cross trading strategy
When the price is in a downward trend, the fast line crosses up through the slow line, forming a golden cross, which means the trend may shift from downward to upward, providing a buying opportunity.
When the price is in an upward trend, the fast line crosses down through the slow line, forming a death cross, indicating that the trend may shift from upward to downward, which is a rational short entry point.
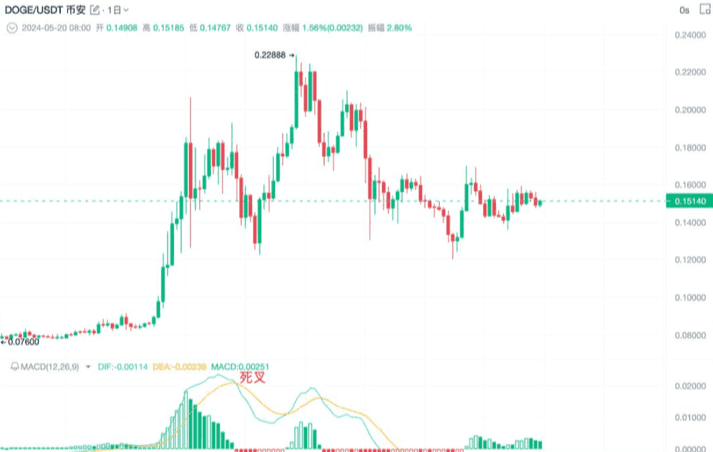
This is the traditional MACD usage.
3. MACD divergence trading strategy
1. MACD top divergence
When the price's high is higher than the previous high, this is called higher highs.
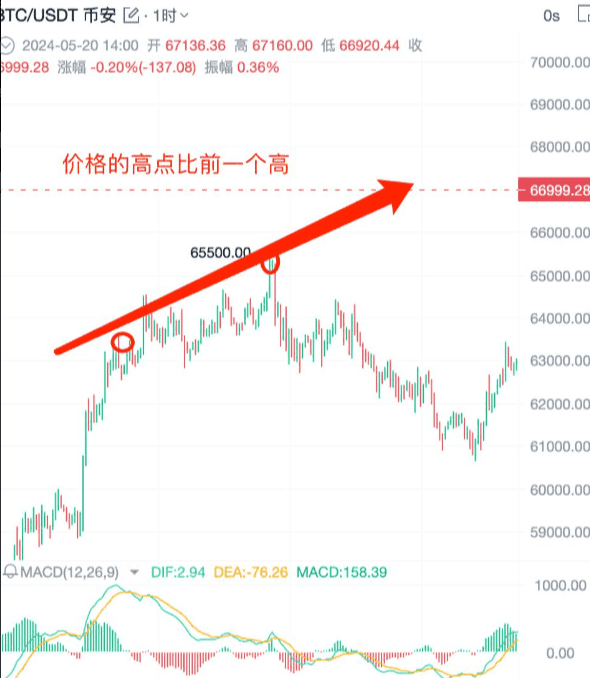
When the price's high is higher than the previous high, it forms higher highs. Under normal circumstances, the MACD should also form higher highs to match the price trend momentum.
If at this time MACD forms lower highs, it indicates a weakening of price trend momentum.
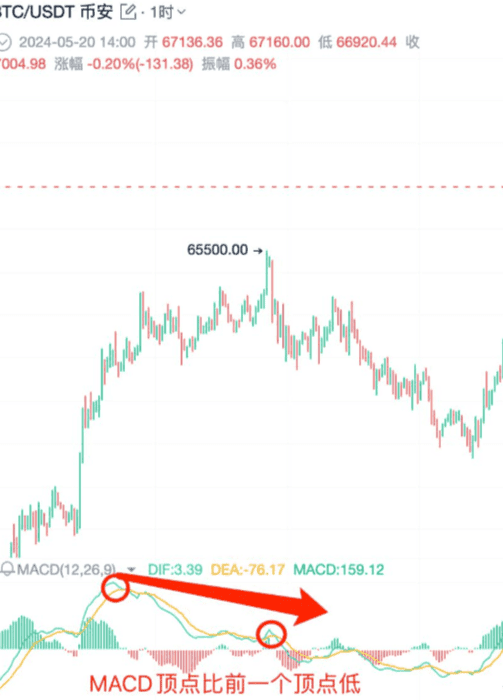
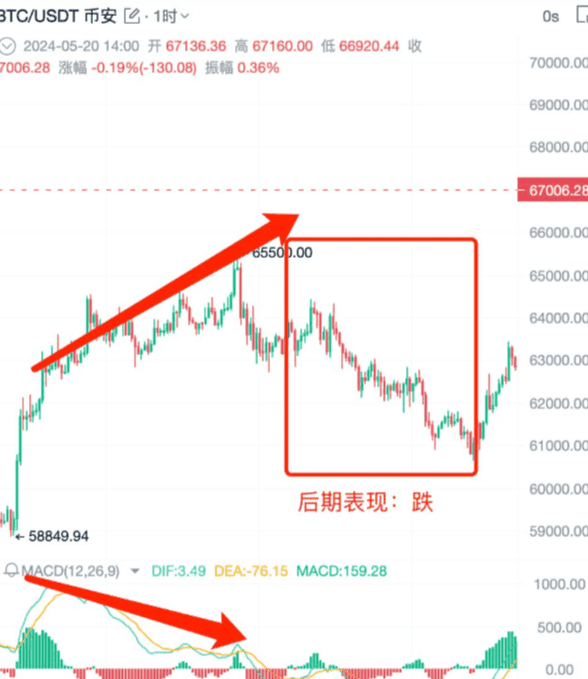
When the price forms higher highs but the MACD forms lower highs, this is called a top divergence, and at this point, the price trend is likely to turn down.
To confirm the trend, you need to find key price levels and MACD trend reversal divergence.
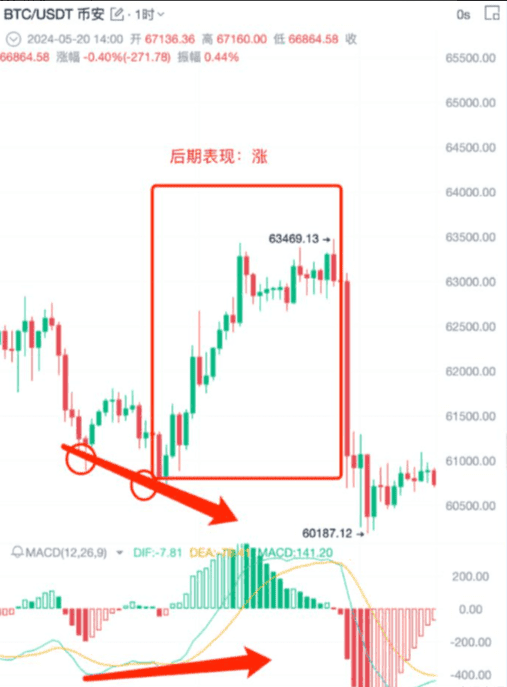
2. MACD bottom divergence
The price's low is lower than the previous low, which is called lower lows.
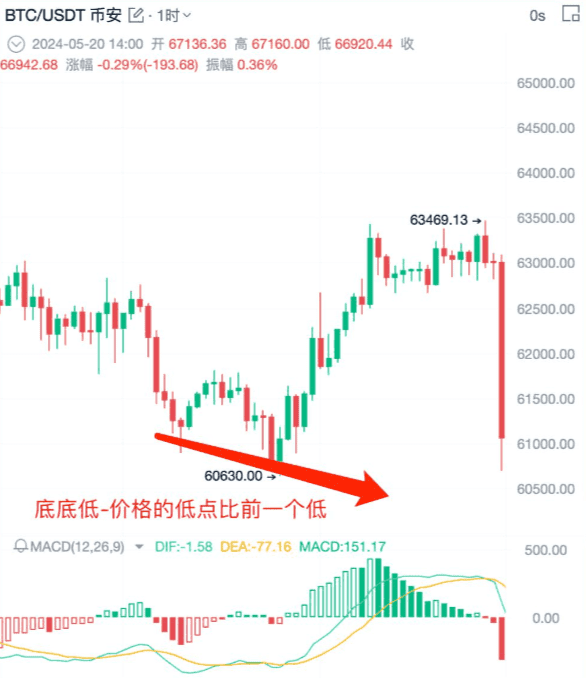
At this time, if MACD forms higher lows, it means the buying momentum begins to intervene, and the downward momentum of the price gradually weakens.
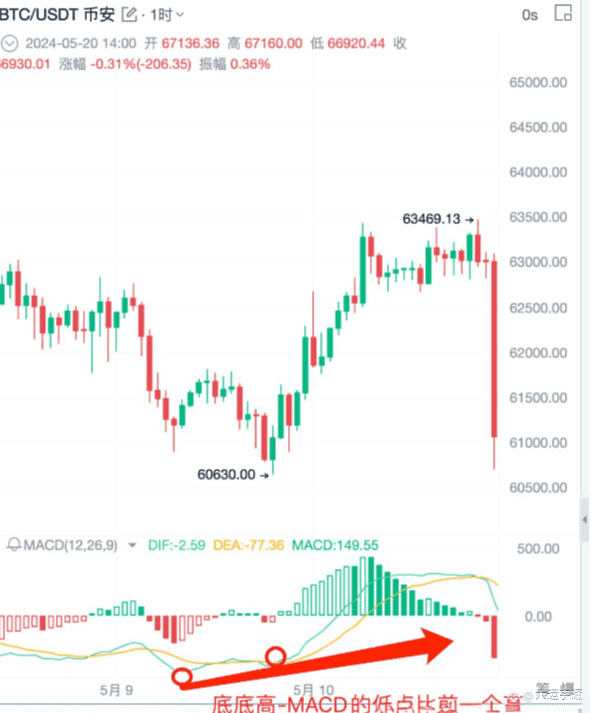
The trend is likely to change from a downward trend to an upward trend. When the price forms lower lows, but the MACD forms higher lows, this is called bottom divergence. When bottom divergence forms, it means that the trend is likely to change to an upward trend, which is a reasonable buying opportunity.
3. MACD trend reversal trading strategy
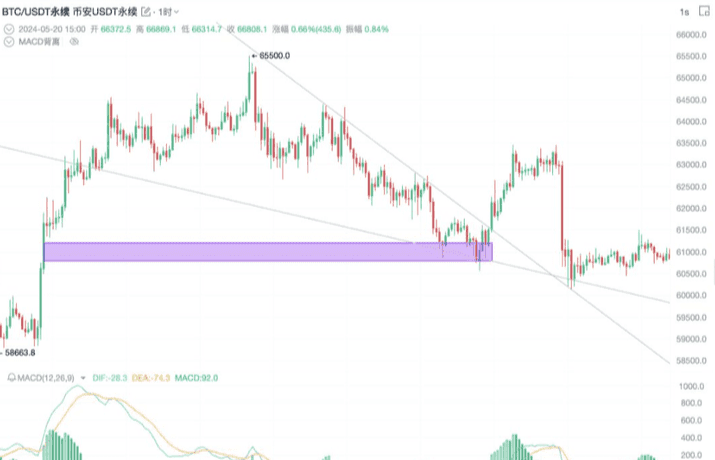
Key price levels and MACD trend reversal divergence: find the connecting line between two peaks, while also finding the corresponding two peaks at the bottom MACD.
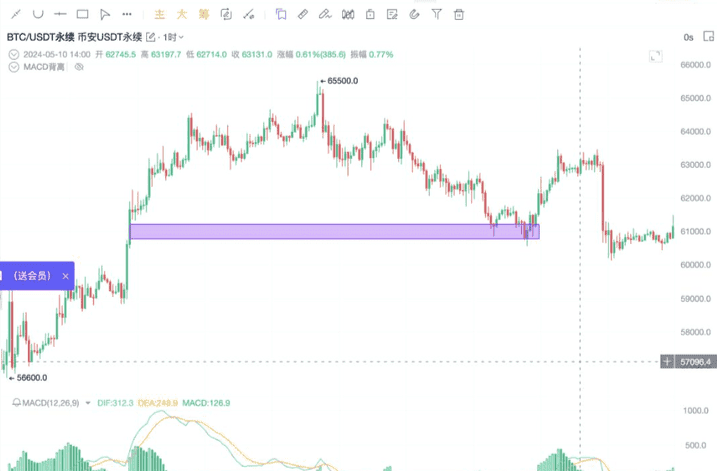
Determine key support levels: when the price repeatedly tests a certain support level and shows a significant rise, that support level is a key support level. When the price returns to the key support level again, you can look for trading signals to go long.
For example, we find a peak that has gone through a round of ups and downs and has returned to the support level.
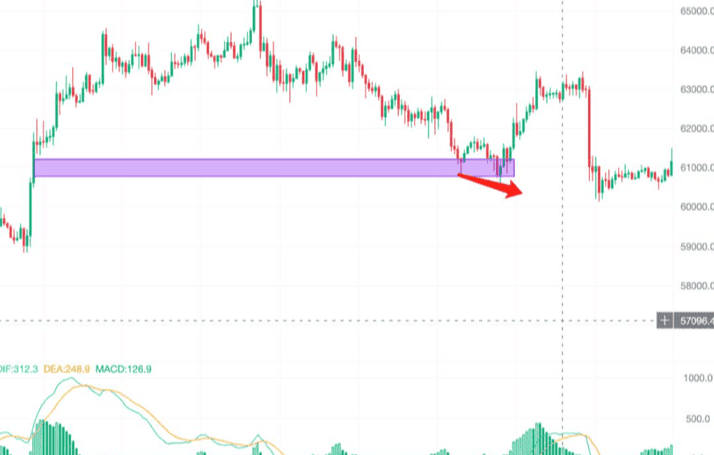
For example, when the price comes back to the support level after a round of ups and downs, you cannot go long directly; you need an additional signal to confirm the effectiveness of bottom divergence. You can draw a downward trend line; if it forms a descending wedge triangle (a bullish chart pattern), when the price breaks through the descending wedge triangle, you can enter long.
You can see that this is a descending wedge triangle, which is a bullish chart pattern. When the price breaks through this descending wedge triangle, we can enter long.
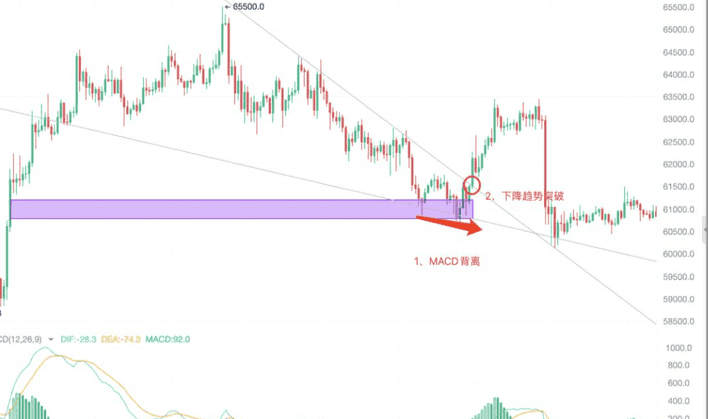
If both points are met, and the downward trend line is broken, you can consider going long. Draw a line at the previous high of the downtrend; when the price breaks the previous high, it indicates a trend reversal, and the price is likely to change from a downward trend to an upward trend. In short, trading should combine key price levels and MACD trend reversal divergence. In summary: key price levels + MACD trend reversal divergence.
4. How to find support levels?
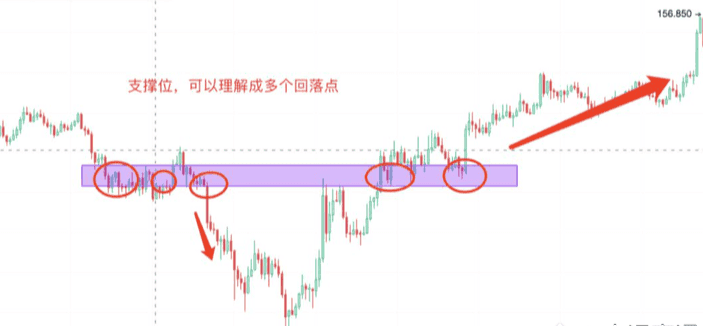
Support levels can be understood as multiple retracement points, which can form valleys or peaks. At the foot of the mountain, prices often retest multiple times. Support levels can be a small price range or a specific point. At the same time, key price levels and MACD divergence should be used to judge, the key is to see if the support level has been broken.
Finally, let me share the best practical advice with everyone:
The method of position management is to operate in batches.
Batching: there are two types: equal batch and unequal batch.
First: equal distribution, also known as rectangle trading method, refers to dividing funds into several equal parts and buying or selling in turn, with the same proportion of funds for each transaction. Usually, 3 or 4 parts are used. For example, buy 30% first, if you start to profit, buy another 30%, if not, do not intervene with new funds temporarily. When the price of the cryptocurrency reaches a certain high point or the market changes, sell in batches.
Second: unequal distribution, refers to buying or selling funds in different proportions, ratios of 1:3:5, 1:2:3:4, 3:2:3, and other different ratios. The shapes generated by the ratios can be classified into: diamond, rectangle, hourglass, etc., commonly used is pyramid-shaped trading method.
Third: with equal funds and positions, use different methods for comparison.
Pyramid: buy 5 layers at 1000, 3 layers at 1100, 1 layer at 1200, average price 1055
Inverted pyramid: buy 1 layer at 1000, 3 layers at 1100, 5 layers at 1200, average price 1144
Equal batches rectangle: buy 3 layers at 1000, 3 layers at 1100, 3 layers at 1200, average price 1100
Price rises to 1200 with profits: pyramid 145, inverted pyramid 56, rectangle 100
Price drops to 1000 with losses: pyramid +55, inverted pyramid -144, rectangle -100
For example: if a cryptocurrency falls to 10 yuan, buy in 20% of the position, and when the price drops to 8 yuan, enter another 30%. At this point, the average cost is 8.6 yuan. If the market continues to drop to 5 yuan, enter another 40%, making the average 6.5 yuan. If the price rebounds to 6.5 yuan, it is considered break-even. If it rebounds to 10 yuan, you have earned 3.5 yuan. But if you fully invested at 10 yuan, when the price returns to ten yuan, you have just broken even.
This is my personal view and insights. If you find it helpful, you can like and bookmark it. I am Dayun, someone who has experienced three rounds of bull and bear markets, good at logical coin selection and technical timing. I only trade within my cognitive range, and every direction has been verified by the market!
Brother Ming only does real trading, and the team still has positions available.#美联储重启降息步伐


