🔥 FIS/USDT Daily Market Analysis 🔥
The market is heating up, and FIS has finally shown signs of strength after a long period of sideways movement. Currently, FIS/USDT is trading at $0.1275, posting an impressive +14.56% gain in the last 24 hours. Let’s break down the key details 👇
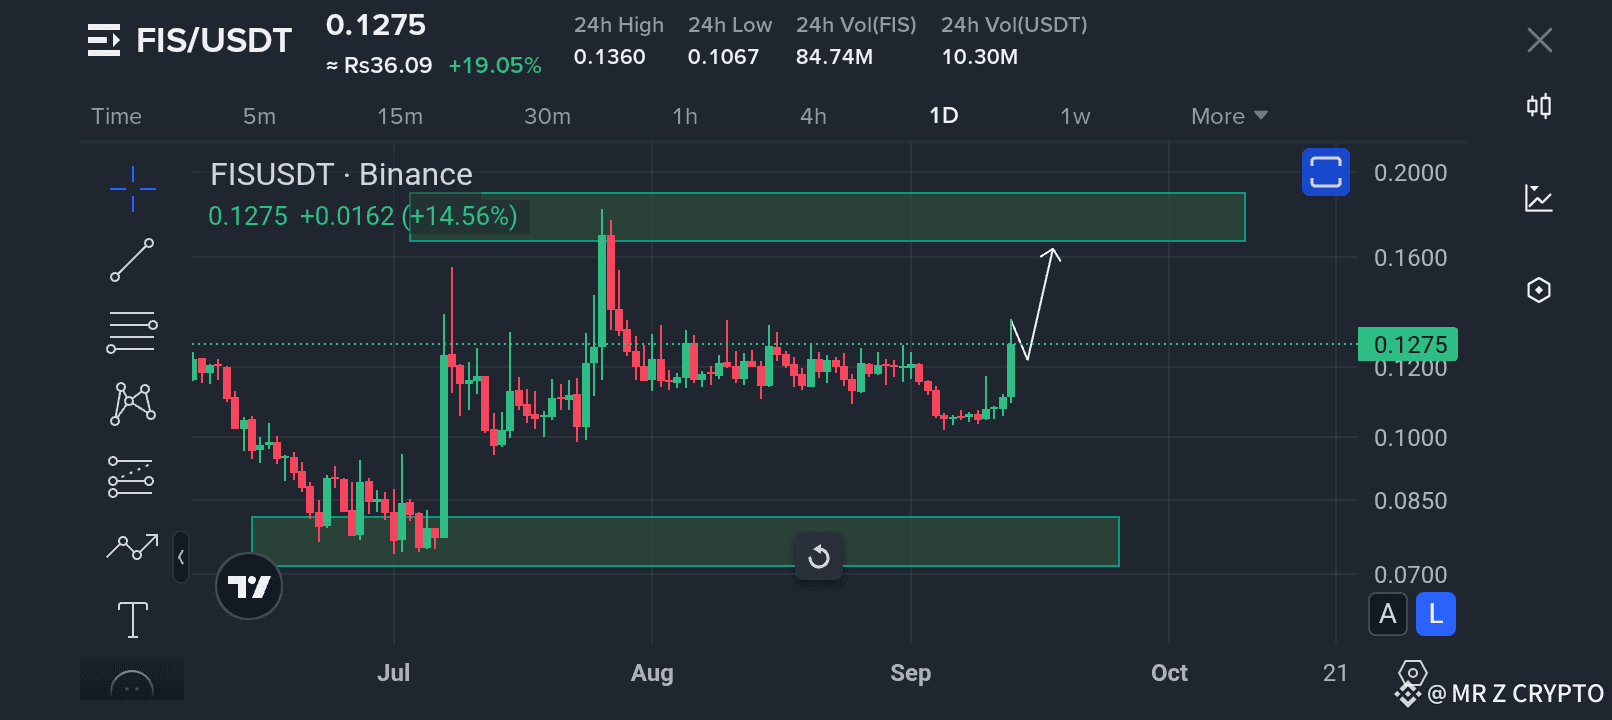
📌 Current Snapshot
Price: $0.1275
24h High: $0.1360
24h Low: $0.1067
24h Volume: 84.74M FIS (≈10.3M USDT)
Change (24h): +19.05%
This sudden surge in price and volume indicates fresh buying interest and a possible trend reversal after weeks of consolidation.
🟢 Support & Resistance Levels
Major Support Zone: $0.085 – $0.090
→ Price bounced strongly from this level in the past, making it a crucial demand zone.Immediate Resistance Zone: $0.160 – $0.200
→ If momentum continues, this will be the next major barrier to break.
📈 Technical Outlook
After weeks of accumulation, the chart shows a bullish breakout attempt.
The recent green candle with strong volume suggests that buyers are stepping in aggressively.
A short-term pullback to retest around $0.120 – $0.125 is possible before continuation toward the $0.16–$0.20 resistance zone.
Breaking above $0.20 could open the door for further upside.
🔮 Market Sentiment
The market sentiment around FIS is turning positive. Traders are eyeing the breakout levels, and the volume confirms that interest is picking up. This setup looks promising for swing traders and short-term momentum players.
⚠️ Important Note: While the technicals look bullish, the crypto market remains volatile. Always manage your risk, set stop-losses, and trade wisely.
📊 Summary:
FIS is gaining strength after a long period of sideways movement. If the momentum holds, the next target range is $0.16 – $0.20. Keep an eye on volume and price action around these key levels.
🚀 Could this be the start of a bigger rally for FIS? Time will tell!