In the last session, we explained the flags and wedges in continuous patterns. This chapter will combine candlestick chart techniques with trend line market breakthroughs and past support and resistance areas for comprehensive study. We can determine market trends through many methods, and trend lines are one of them. This is one of the most basic tools for technical analysts.
Support and resistance lines of the candlestick chart
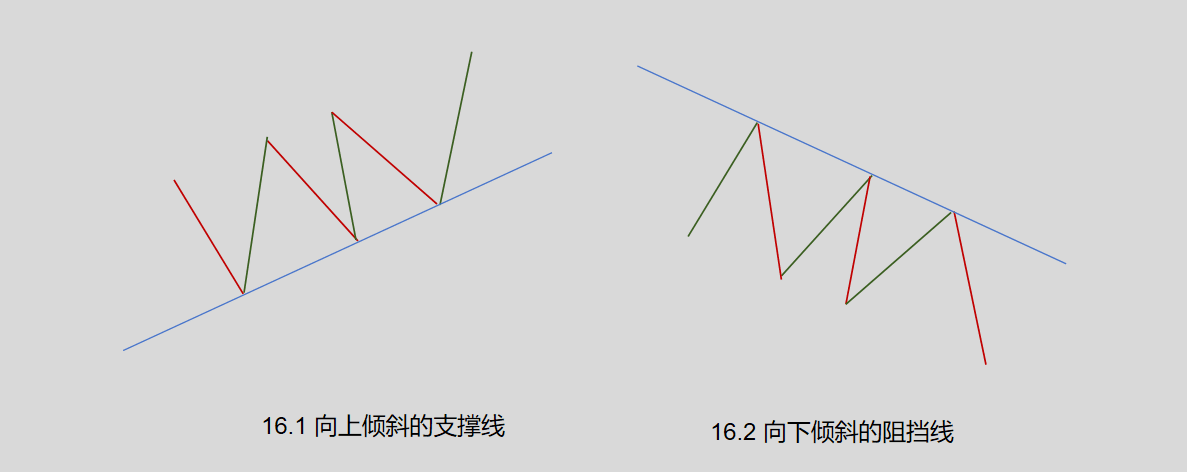
Figure 16.1 shows an upward sloping support line. At least two upward rebound low points are needed to connect such a straight line. This support line indicates that during this period, buyers are more active and aggressive than sellers, as new demand can still be generated at gradually rising new low points. This line signifies that the market is in an upward trend.
Figure 16.2 shows a downward-sloping resistance line. At least two peaks that rebound downward are needed to connect such a straight line. This resistance line indicates that sellers are bolder and more aggressive than buyers during this period, as they continue to attract selling intentions at gradually lowering new highs. This line reflects that the market is in a downtrend.
The strength of support or resistance lines (pressure lines) depends on the following factors:
1. Dwell time and trading volume
The longer the price stays in this area, accompanied by larger trading volumes, the stronger the effectiveness of the support or resistance area. For example, long-term price concentration areas usually have stronger support/resistance effects than short-term fluctuation areas.
2. The proximity of time to the current market
The closer the support/resistance area is to the current time, the greater its influence. For example, if recent highs or lows are broken, if the price returns to that area, investors are more likely to have psychological expectations, enhancing the support/resistance effect.
3. Trend stages and angles
The difficulty of breaking through pressure lines in a downtrend or support lines in an uptrend is higher. For example, in a downtrend, breaking through the pressure line formed by recent lows requires more momentum, while in an uptrend, the effectiveness of the support line formed by highs is higher.
4. Area types and market sentiment
The support/resistance effect in areas of high trading volume (such as long-term oscillation ranges) is more significant. When the price of the coin pulls back to this area, investors may feel psychological pressure due to missing buying/selling opportunities, affecting subsequent trends.
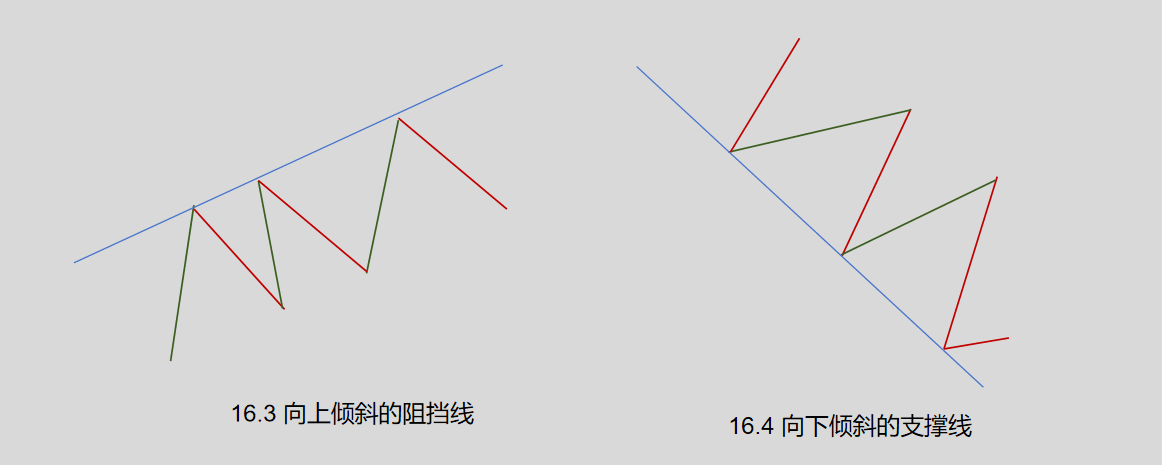
Figure 16.4 shows a downward-sloping support line. Such straight lines are not often used, but they can be very useful for short sellers in certain situations. Specifically, this type of downward-sloping support line is a sign of a downtrend (its downward slope indicates this). However, if the market can successfully maintain above such support lines, short sellers should take precautionary measures to guard against price rebounds.
The importance of taking protective stop-loss measures:
We should use technical analysis to assess the risk/reward ratio. Only in this way can analysts provide an effective control mechanism. This leads to a trading approach based on risk and profit management. Determining risk means setting protective stop-loss orders to help us guard against unexpected adverse price changes. If a technical analyst does not take stop-loss measures, then they have squandered one of the strongest advantages of technical analysis.
We should set the stop-loss level when initially establishing a trading position: only at this time can we be the calmest and most objective. We can only continue to hold the initial trading position under the conditions that the market evolution meets our original expectations. If subsequent price changes are contrary to our expectations, or even just fail to confirm our expectations, we should decisively close the position. If the market movement is opposite to your position, you may wonder why implement stop-loss measures—this is just a brief counter-direction change. In this way, you stubbornly hold onto this position, hoping the market will eventually return to your direction.
Please do not forget the following two facts:
1. All long-term trends start with short-term trends;
2. There is absolutely no room for unilateral wishes in the market; the market operates on its own, indifferent to your thoughts and positions.
The market does not care whether you follow its trends. One thing is far worse than making mistakes: sticking to the wrong ones. It is better to give up your high opinions than to lose your money. Being able to correct your mistakes early is actually something to be proud of. Having a stop-loss order enforced by the market means admitting a wrong and surrendering. People detest admitting mistakes because it often involves personal pride and reputation. Excellent traders are never overly obstinate.
Our resources are limited. Therefore, these resources should be maximally increased and at least well maintained. If you find yourself in a market where the market direction is opposite to your position, that is exactly when it's time to stop loss and look for good opportunities elsewhere. Think about it, why not regard the losses from stop-loss as the cost of your investment career.
