In the continuous pattern system of technical analysis, we have mastered the market's "ready to go" basic signals through the dissection of symmetrical triangles, ascending/descending rectangles . In this issue, we will turn our attention to two types of more explosive continuation patterns—flags and wedges. They serve as a "brief consolidation zone" after severe market fluctuations, retaining the momentum of the original trend while providing traders with key entry clues through their structural forms. Especially in high-volatility markets like cryptocurrency (coin circle), the identification and application of flags and wedges are often the "sharp tools" for capturing trend continuation.
In-depth analysis of continuous patterns: flag
The essence of the pattern and visual characteristics
The flag is a typical "trend acceleration pattern" with a highly vivid name—after the market experiences a steep trend (main trend), prices suddenly enter a narrow consolidation range that slopes in the opposite direction of the original trend, resembling a "small flag hanging on a flagpole". This characteristic of "short-term correction after rapid rise/fall" makes it an important marker for distinguishing between "trend continuation" and "trend reversal."
Based on the original trend direction, flags can be divided into two categories:
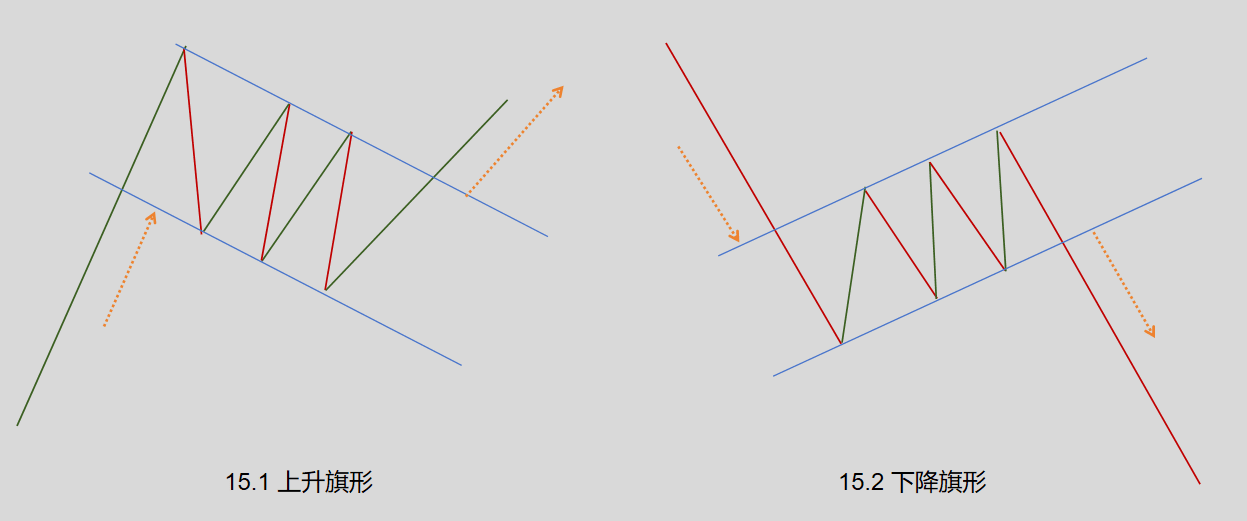
Ascending flag (Figure 15.1): appears after a steep rise in price. After completing a round of rapid price increase (forming the "flagpole"), it enters a period defined by two downward-sloping parallel lines (flag surface), overall presenting a structure of "flagpole upward, flag surface downward."
Descending flag (Figure 15.2): appears after a sharp decline in the market. After a round of rapid price drop (flagpole), it enters a consolidation range defined by two upward-sloping parallel lines (flag surface), presenting a reverse structure of "flagpole downward, flag surface upward."
Key identification points (with practical logic from the crypto circle)
1. The "Three-Stage Theory" characteristic of trading volume
The volume changes in a flag pattern are its core verification indicators:
Flagpole formation period: accompanied by drastic price fluctuations, trading volume often continues to expand (intense capital competition drives trend acceleration);
Flag surface consolidation period: trading volume significantly shrinks (bull-bear divergence narrows, chips tend to stabilize);
Breakout confirmation period: whether breaking upward or downward, trading volume must expand again (capital re-enters to drive the trend continuation).
Note: This characteristic differs from most continuous patterns (such as triangles)—the volume may gently increase during the triangle breakout, while the breakout of the flag often accompanies "volume confirmation", emphasizing the strong continuity of the trend.
2. The "Degree" of time cycles
The consolidation time of the flag should not be too long (usually no more than 1/3 of the original trend cycle). If the consolidation exceeds 2-3 weeks (even shorter in the high volatility market of the crypto circle), the pattern may become invalid: on one hand, the market's "memory" of the original trend will fade; on the other hand, prolonged sideways movement may evolve into a reversal pattern (such as transitioning into a rectangle or triangle).
3. Calculation of the minimum target: "Flagpole Replication Rule"
As a continuous pattern, the theoretical minimum price increase (or decrease) after a breakout must at least cover the length of the "flagpole". The specific calculation method is: the distance from the starting point of the flagpole (the trend initiation point before the flag pattern) to the top (ascending flag) or bottom (descending flag) of the flag surface is the target level that must be reached after the breakout. This rule is particularly effective in the crypto circle—due to the strong trend of cryptocurrencies, the "flagpole replication" after a breakout often accompanies accelerated market movements.
4. The unique "three-wave structure" adaptability in the crypto circle
Combined with Elliott Wave Theory, flags often appear in the three-wave structure of the crypto circle: for example, after a rapid rise in the first wave (flagpole) of the main upward wave, the second wave (flag surface) consolidates with a flag pattern, followed by the third wave (main upward) continuing the trend. This high matching degree makes flags a "must-watch formation" for crypto swing traders.
5. The "Pullback Confirmation" opportunity after a breakout
After a flag breakout, prices may sometimes experience a brief pullback (testing the validity of the breakout); this is a better entry point: if the pullback does not break the flag surface boundary (ascending flag does not break the lower line, descending flag does not break the upper line), then the breakout is confirmed valid, and one can add positions accordingly.
In-depth analysis of continuous patterns: wedge
The essence of the pattern and visual characteristics
The wedge is a "relative" of the flag, but its structure is more complex—it consists of two converging lines that slope in the same direction (upward or downward), resembling a "compressed triangular band". Unlike the flag's "reverse consolidation", the "same direction inclination" of the wedge gives it both "trend correction" and "momentum exhaustion" dual properties, thus requiring more caution in trend judgment.
Based on the slant direction, wedges can be divided into two categories:
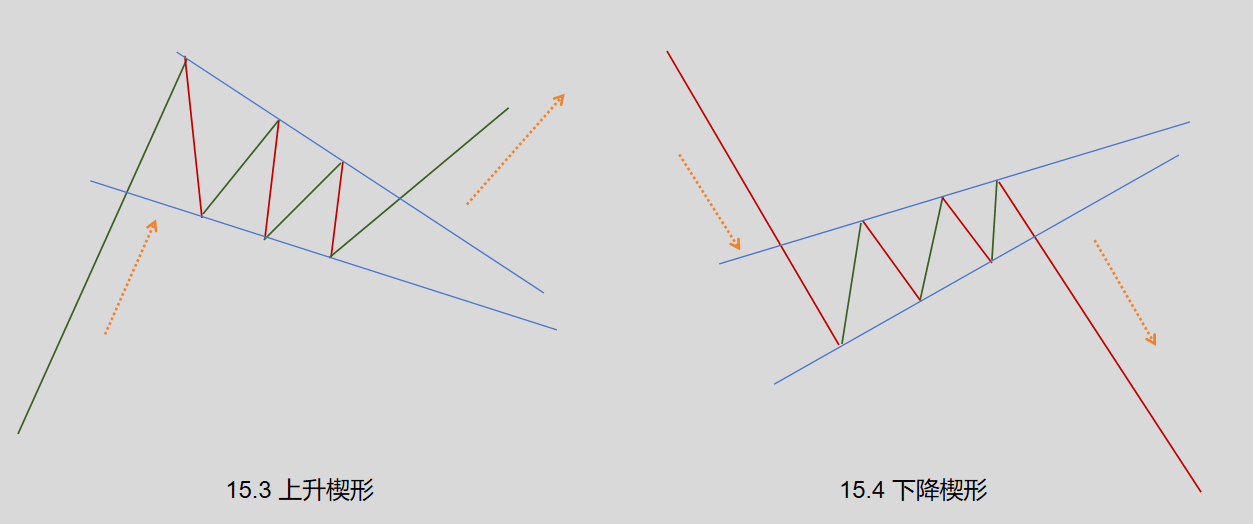
Ascending wedge (Figure 14.3): both boundary lines slope upward simultaneously, but the upward angle gradually narrows (upper edge slope > lower edge slope). It usually appears during bear market rebounds, serving as a "pseudo-bull trap" in a bearish trend;
Descending wedge (Figure 14.4): both boundary lines slope downward simultaneously, but the downward angle gradually narrows (lower edge slope > upper edge slope). It often appears in bull market corrections, serving as a "false breakdown signal" in a bullish trend.
Key identification points (a guide to avoiding pitfalls in the crypto circle)
1. Convergence is the core prerequisite
The effectiveness of the wedge shape heavily relies on the "convergence" of two boundary lines—if the two lines remain parallel or diverge, the pattern does not hold. An ideal wedge should meet the condition that over time, the upper and lower edges gradually converge, ultimately pointing to a clear "convergence vertex" (usually formed within 1-3 months).
2. The "Differentiated Verification" of trading volume
The volume patterns of the wedge are similar to those of the flag (overall decreasing), but the volume requirements at the time of breakout vary by direction:
The ascending wedge breaks downward: no need for an increase in volume (as it is essentially a continuation of the bearish trend, market selling pressure has already accumulated);
Ascending wedge breakout: must be accompanied by an increase in volume (bulls need volume to push through the wedge's resistance).
Crypto circle warning: If the descending wedge breaks out without an increase in volume, it may be a "false breakout", and one should be wary of the risk of a second bottom.
3. Role differentiation in the "three-wave structure" of the crypto circle
The ascending wedge often serves as the pattern for the B wave rebound (in a bear market, A wave down → B wave rebound consolidating with a wedge → C wave accelerating downward); while the descending wedge often serves as the pattern for the 4th wave adjustment (in a bull market, 1 wave up → 2 wave adjustment → 3 wave main rise → 4 wave consolidating with a wedge → 5 wave accelerating upward). Clearly identifying its position in the waves can significantly increase the trading success rate.
4. The "Pullback Confirmation" strategy after a breakout
After a wedge breakout, prices may also experience a pullback (the ascending wedge pulls back to the upper edge, the descending wedge pulls back to the lower edge). If the pullback does not break the boundary line, and the trading volume matches (volume increase at breakout, volume decrease at pullback), it indicates a high probability second entry point.
Summary: Quick reference table for the practical differences between flags and wedges
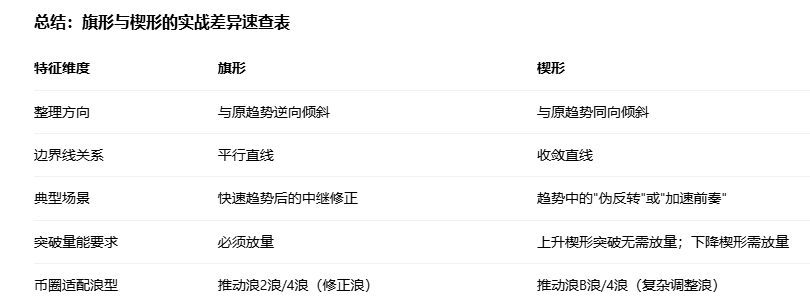
Mastering the detailed differences between flags and wedges, combined with the unique high volatility and wave structure of the crypto circle, traders can more accurately capture trend continuation opportunities, seizing key signals during "rapid rises and falls" in the market.
(Note: The boundaries of formations such as "flagpole" and "flag surface" in this text need to be verified with specific K-line charts; in actual trading, it is recommended to filter false signals using indicators like moving averages and MACD.)
