Continuous consolidation patterns refer to sideways fluctuations that enter the existing trend, digesting chips through time and continuing the original trend's movement. The premise for their existence is that the market has a clear prior trend. This pattern usually lasts for a shorter duration and belongs to the categories of transient or medium patterns, mainly including four types: triangle, rectangle, flag, and wedge, among which triangle consolidations occur most frequently.
Continuous consolidation patterns usually show characteristics of price fluctuation convergence and decreasing trading volume. When a breakout occurs, it is necessary to observe the volume-price coordination situation. The minimum fluctuation amplitude after the breakout is related to the initial fluctuation amplitude, for example, the breakout amplitude of a rectangle must be at least the width of that pattern. Compared to reversal breakout patterns, there are no absolute boundaries, but continuous consolidation patterns tend to be more pronounced: triangles are mostly continuous consolidation patterns, occasionally evolving into reversal patterns; the same figure may change in properties over different cycles, for example, a head and shoulders pattern can turn into a continuation pattern in a larger cycle.
Common characteristics of persistent patterns:
1. In the consolidation phase between an upward trend or a downward trend, bullish signals appear in an upward trend, and bearish signals appear in a downward trend subsequently.
2. The trading volume shows a shrinking state.
3. The time cycle is usually shorter than that of reversal patterns.
4. A subsequent increase in volume and breakout pattern serves as the main entry point.
Symmetrical Triangle
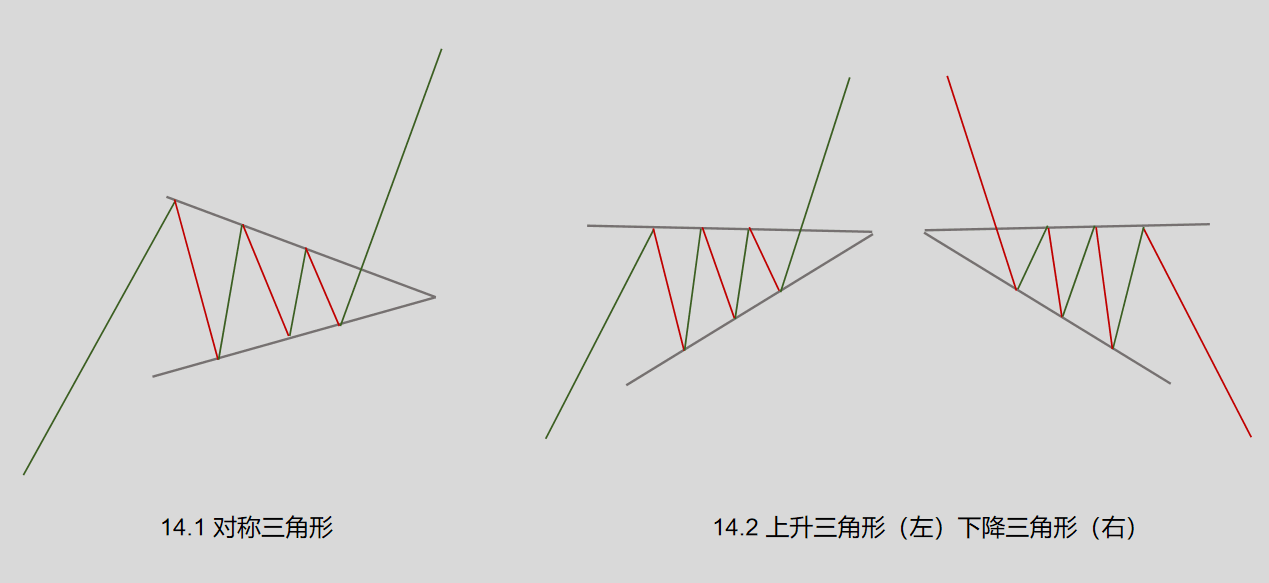
As shown in Figure 14.1, the formation process of the symmetrical triangle: when the price enters the consolidation phase, its fluctuation range gradually narrows, meaning that the highest price in each movement is lower than the previous level, and the lowest price is higher than the previous level. The upper limit of the price fluctuation area is a downward sloping line, and the lower limit is an upward sloping line, thereby forming a relatively symmetrical triangle. During this process, the trading volume gradually decreases, and the power comparison between bulls and bears tends to balance. When the price reaches the top of the triangle, the power comparison between bulls and bears changes, and the price breaks through the triangle area, thus ending the consolidation state and continuing the original trend.
When judging the shape of a symmetrical triangle, the following aspects should be noted:
1. In the symmetrical triangle, the closer the price approaches its vertex without breaking through its boundaries, the weaker its strength becomes. Breakouts that are too close to the vertex often fail.
2. The breakout point should be located about 1/2 to 3/4 of the distance from the bottom edge of the triangle.
3. When the price breaks upward through the triangle, it requires large trading volumes to cooperate, while downward breakouts do not have this requirement.
4. When the price breaks through the boundary, its upward or downward amplitude should be at least the distance of the triangle's base.
5. After the price breaks through the triangle, a pullback phenomenon will appear. At this time, the pullback after the upward breakout should stop at the extension of the upper boundary line, and the pullback after the downward breakout should stop at the extension of the lower boundary line. Otherwise, this breakout may be a false breakout.
6. In the cryptocurrency market, three waves are generally predominant.
Ascending Triangle and Descending Triangle

As shown in Figure 14.2, unlike the symmetrical triangle, after the price enters the consolidation phase, the highest price basically belongs to a horizontal line, while the lowest price tilts upwards, forming an upward-sloping line, thus creating an ascending triangle. The descending triangle is the mirror image of the ascending triangle, with the same components as the ascending triangle.
Its aspects of attention are basically consistent with those of the symmetrical triangle, and the ascending triangle is generally more common in upward trends than in downward trends.
Rectangle (Box)
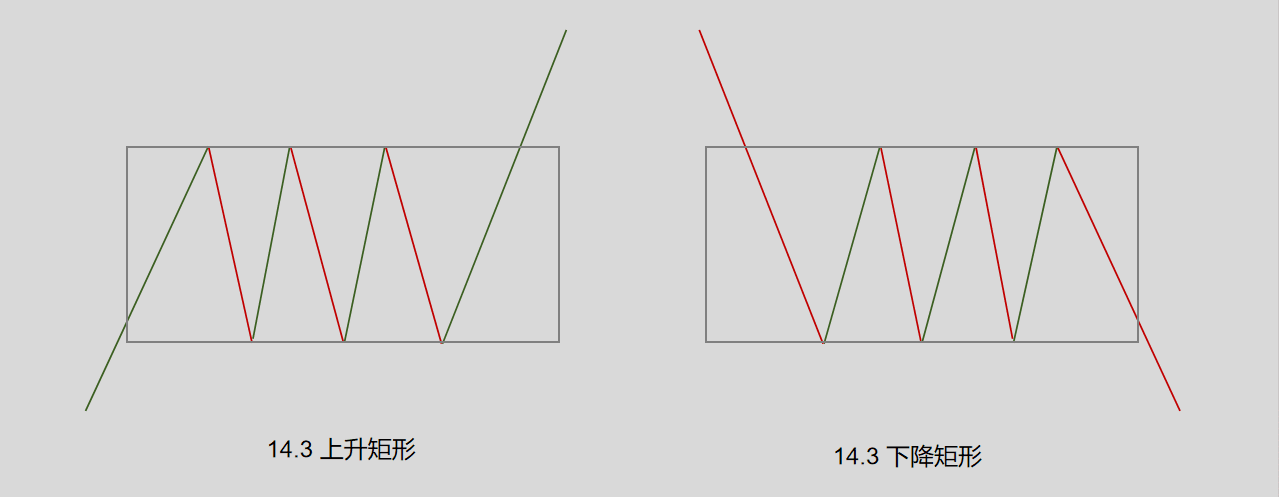
As shown in Figure 14.3, rectangles can also be classified into ascending rectangles and descending rectangles. A rectangular trend refers to the price fluctuating between two horizontal upper and lower boundary lines without breaking through for a long time. At the beginning of a rectangular trend, both bulls and bears compete fiercely, forming a tug-of-war scene. When the price rises to a certain high point, bears sell off in large quantities, suppressing the price; when the price drops to a certain low point, bulls buy in. Over time, two obvious upper and lower boundary lines are formed, and as time goes by, the market becomes less active, and the power comparison between bulls and bears gradually becomes clear, eventually leading to the price breaking through the rectangular pattern and continuing the original trend.
Several aspects to note when judging the rectangular pattern:
1. During the formation of the rectangle, the trading volume gradually decreases.
2. When breaking upward, it requires large trading volumes to cooperate, while downward breakouts do not have such requirements.
3. After the price breaks through the rectangular pattern, its upward or downward amplitude should be at least the width of the rectangle itself.
4. Sometimes, there will be a pullback confirmation after a breakout, which is also a relatively good entry point.
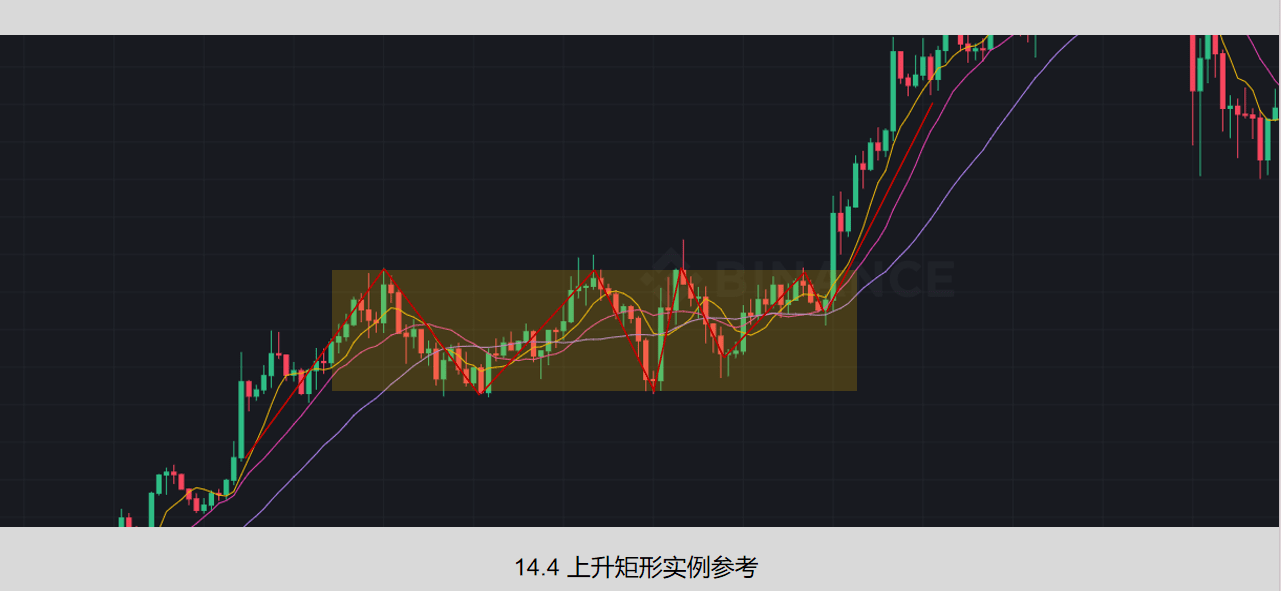
As shown in Figure 14.4, this is an example of an ascending rectangle. The market originally showed an upward trend, then declined while bulls and bears continued to tug within the yellow rectangular frame, eventually breaking through and continuing upward.
In the next issue, we will update the flag and wedge patterns in persistent forms. Today's sharing is not the end but the starting point for cognitive upgrades. When we turn learning into a daily habit, transform mind maps into thinking maps, and integrate deliberate practice into the rhythm of life, we will eventually reap "those seemingly uneventful day by day, which will one day show you the meaning of persistence." Follow Apeng, and we will progress together.
