
Core indicators (Hong Kong time September 1, 16:00 to September 8, 16:00)
BTC/USD rose 1.6% ($109,600→$111,300), ETH/USD fell 4.0% ($4,470→$4,290)
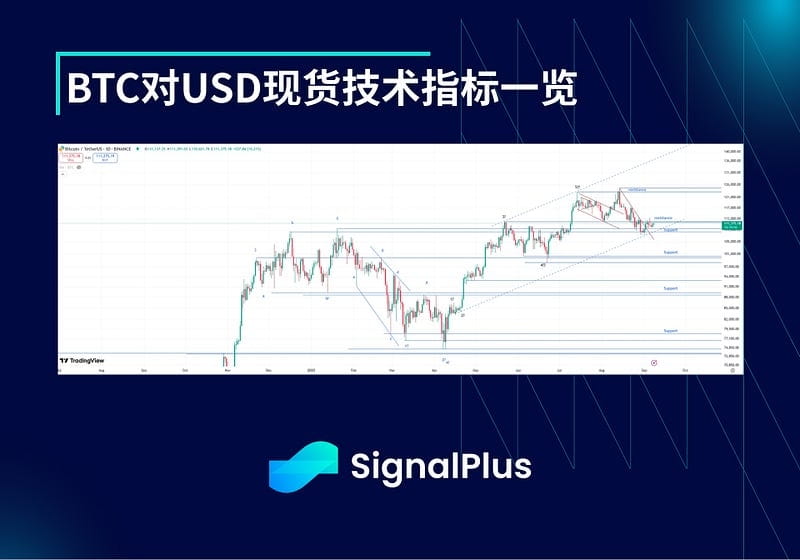
The BTC spot market has been unclear in the past two months: although it touched the lower end of the long-term target range ($125,000–$135,000) in August, the pattern is not good, and subsequent price behavior needs to be assessed cautiously. The current technical structure shows a double top pattern, having rebounded after touching the key level of $125,000 twice, indicating that the market may enter a sideways adjustment mode. If it fails to break the previous high again, it may trigger a deeper correction.
Short-term resistance levels are at 112,000, 117,000, and 125,000–126,000 USD; downward support/breakout points are at 109,000 USD and 100,000–101,000 USD. Based on the price trend of this cryptocurrency, actual volatility is expected to continue rising in the next two months.
Market theme
The first week after the summer ended saw the market caught in a tug-of-war: macro risk assets continue to be supported (this week's US economic data slowdown confirms the rationale for a 25 basis point rate cut at the September 17 FOMC meeting, driving continued ETF inflows); however, the native selling pressure from the crypto community is strong, and retail buying is weak (exchange deposits have sharply decreased from peak levels). The asynchronous hedging of long and short forces has led BTC to be temporarily trapped in the 109,000–114,000 USD range, but fluctuations within this range are intense. If one side gains dominance and breaks through the range, it could trigger a spike in volatility—if selling pressure eases or is absorbed by strong buying, the market is likely to continue its upward trend (as seen from BTC's skew, current local bullish positions are insufficient); if the macro environment worsens or ETF inflows decline (or even turn into outflows), selling pressure may quickly suppress spot prices to below 100,000 USD.
BTC implied volatility
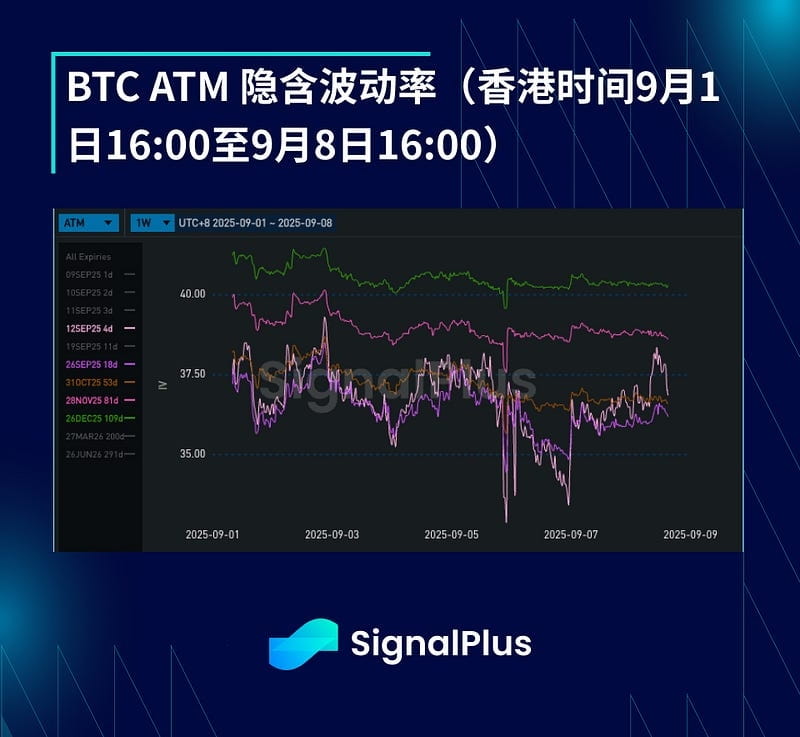
In the past two weeks, the actual volatility has remained in the 35–38 vol range, especially noticeable in hourly fluctuations. The chaos on the technical front, combined with positive macro factors (ETF inflows) and native selling pressure mutually suppressing each other, has made it difficult for the market to form a balance.
The demand for options continues to be weak, with the only significant buying coming from short-term bearish hedging around the non-farm payroll data (positions were closed after the event). Due to the lack of volatility buying, the market is unwilling to raise the pricing of long-term volatility, with the implied volatility of the September and October contracts nearing recent actual volatility levels (35–36 vol).
BTC USD skew/kurtosis
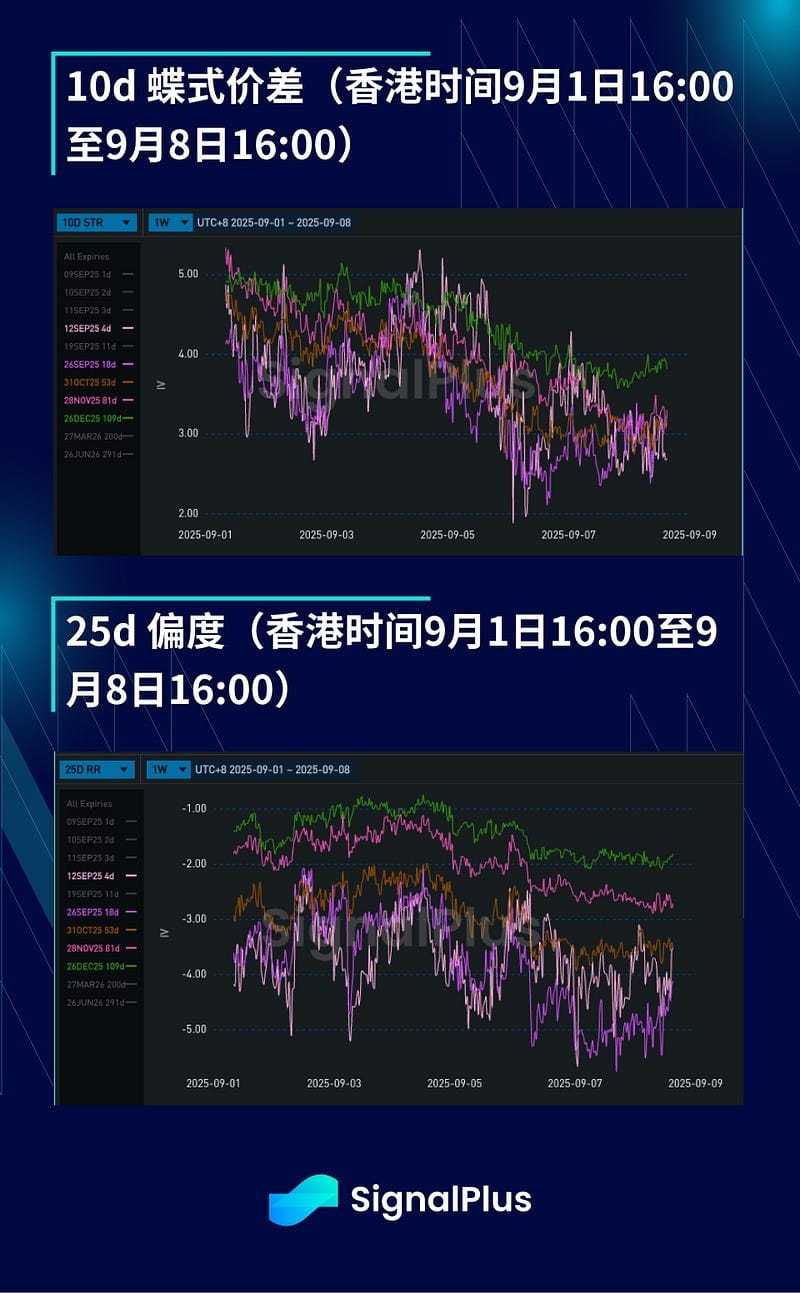
Skew continues to lean downward: despite the favorable non-farm payroll data, price movements remain weak, and the rapid pullback from 113,000 to 110,000 USD has raised market concerns about a deep correction. Structural bullish participation is low, with only data-driven tactical bullish spreads; meanwhile, market interest in volatility for strike prices below 100,000 USD is scarce, resulting in long-term skew approaching parity.
Kurtosis prices are generally declining: the market continues to suppress kurtosis, weakening the pricing of extreme tail risks. Although the volatility of volatility has been relatively stable in recent weeks, historical experience shows that the BTC ecosystem can change rapidly—any significant fluctuations could lead to instantaneous evaporation of liquidity between spot and options, making holding long kurtosis a good choice in the current market.
Wishing you a smooth trading week ahead!