The market is like the sea, sometimes calm and sometimes turbulent, while the true wave riders can always find the right direction on the wave crest. Recently, the Ethereum market has been like an undercurrent beneath a calm surface, causing many retail investors to feel anxious. Don't rush, Brother Long will diagnose the market and provide coping strategies!
Current situation: Bulls and bears are 'arm wrestling', and the direction is about to be revealed.
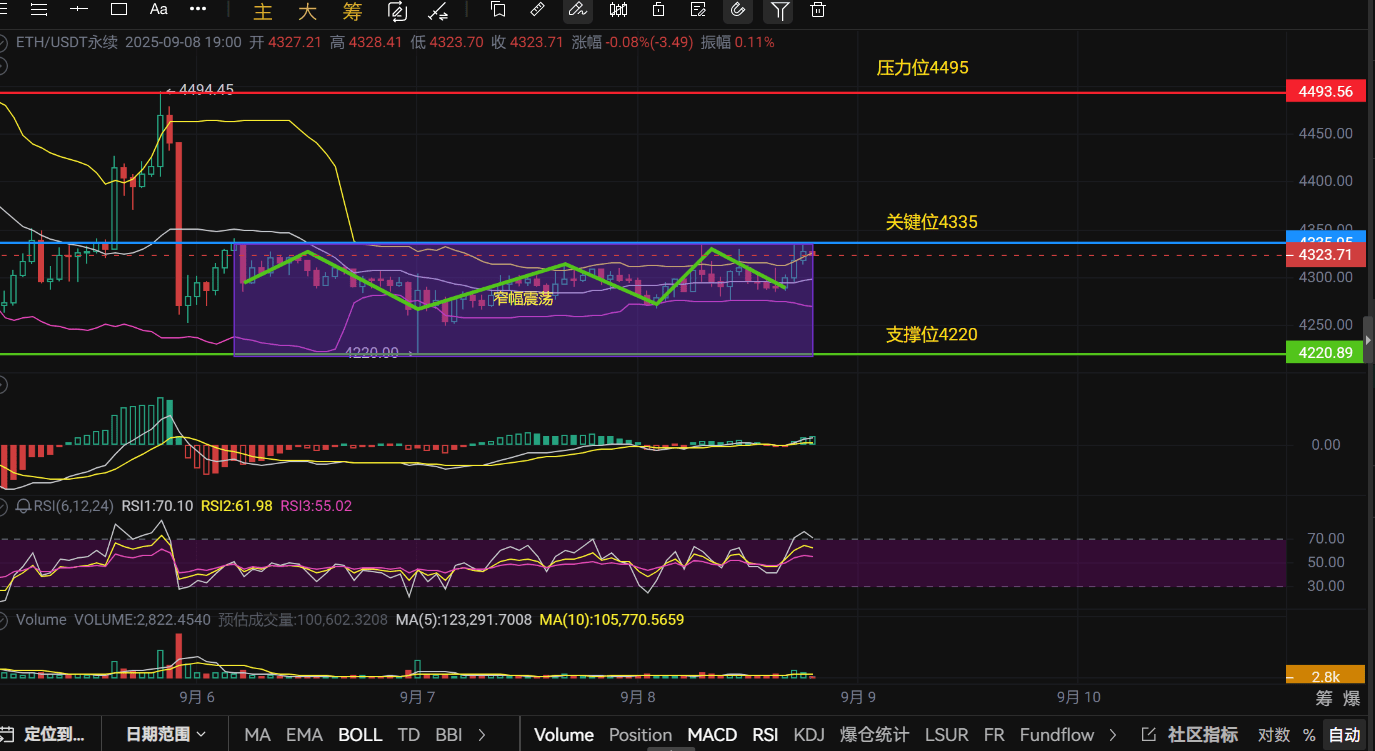
The second pancake has been like a beast trapped in a cage these days, tossing back and forth within the narrow range of $4280 - $4336, with a low dipping to the support level of $4220, and then slightly rebounding. This compressed oscillation is actually building up for a big move, with both bulls and bears accumulating strength, waiting to deliver a fatal blow to each other. The market is about to make a crucial directional choice.
Technical analysis: Mixed long and short signals, hiding mysteries.
From the market structure perspective, the second pie is now at the end of a 'compressed triangle,' like an arrow on the string, ready to shoot.
Support level: The position at $4220 is very critical; it coincides with the middle line of the daily upward channel and the order block, like a solid defense line. If this line is breached, the next support is at $4200, which is a psychological barrier for everyone, followed by $4150 and $4000, which are two important checkpoints.
Resistance level: $4335 is a recent 'roadblock,' and only by breaking through it can we test the $4380 - $4400 area. $4495 is even a 'mountain,' close to recent highs; if we can climb over this mountain, the upward space will be significant.
Moving average system: The fast line is below the slow line, in a bearish arrangement, indicating that the short-term trend is not very optimistic. The price has bounced several times near the fast line but has been blocked, showing that the pressure from the moving average is still significant.
MACD indicator: DIF and DEA are both negative, but the histogram has recently turned positive, indicating a slight improvement in short-term momentum, but overall it is still below the zero axis, and the trend remains bearish.
RSI indicator: The reading is between 44 - 46, indicating it has not entered the oversold or overbought zones, suggesting a relatively neutral market sentiment, slightly biased weak.
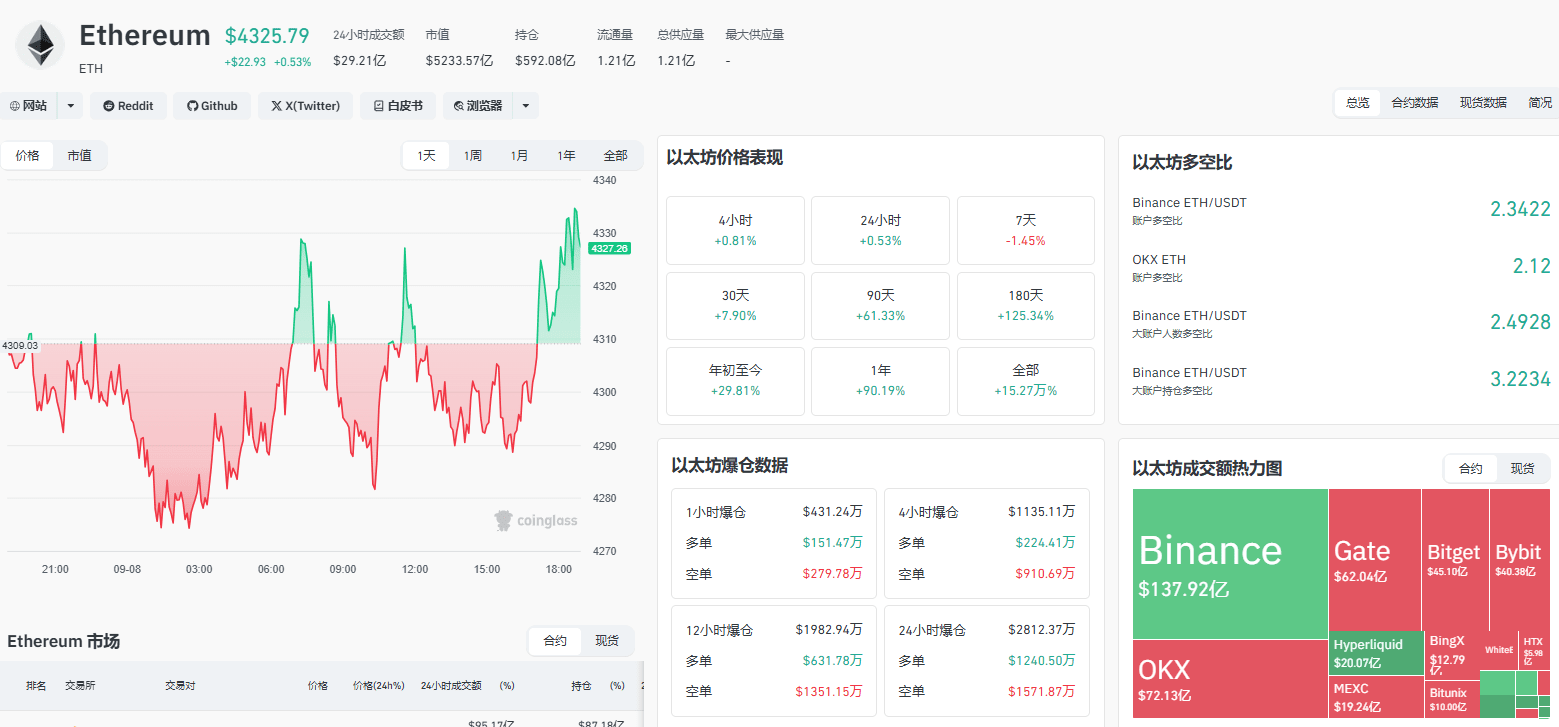
Market momentum: Heavy selling pressure, funds on the sidelines.
Volume data is like the market's 'barometer.' Recently, when the market fell, the volume significantly increased, indicating heavy selling pressure, with many people selling. The recent shrinkage in volume reflects that everyone is waiting and the market lacks new funds to drive a trend reversal.
Long Ge's viewpoint:
Short-term trend: Direction choice is imminent.
The market is now like a balance scale, in a state of equilibrium, but it is about to tilt soon.
Bullish scenario: If the price can break through $4335 with volume and stabilize, it may test the $4380 resistance. If it can break through $4495, then the upward space will open up, with a target towards the $4500 - $4600 area.
Bearish scenario: If the support level of $4220 is broken, it could trigger a chain reaction, and the price may accelerate to the $4150 - $4200 area, or even test the psychological barrier of $4000.

Operational strategy: Varies by individual, respond flexibly.
Short-term traders: Respond to the situation flexibly.
Range trading strategy: Buy high and sell low in the $4220 - $4335 range, like bouncing back and forth between two boundaries. However, stop-loss must be set 30 points outside the range, and the position should not be too large, recommended not exceeding 5% of the principal; otherwise, it could 'flip' unexpectedly.
Breakout tracking strategy: If the price effectively breaks through $4335, then lightly chase long positions, targeting $4380 - $4400; if it effectively breaks below $4220, then lightly chase short positions, targeting $4150 - $4100.
Medium to long-term investors: Steady and solid.
Incremental building positions: Gradually buy near the three key support levels of $4200, $4000, and $3800, like slowly stockpiling food, avoiding one-time full position operations to reduce risk.
Holding for an increase: If you already have a position, continue to hold and set a proper stop-loss. The medium to long-term target can look towards the $5200 - $5500 range, and you may reap a significant market movement.
The market is like a war without gunpowder, with opportunities and risks coexisting. The second pie is now at a critical turning point; breaking upwards above $4335 may ignite a new round of upward momentum; breaking down below $4220 may test lower support levels.
Do you want to get real-time position alerts and accurate entry and exit signals as soon as possible? Follow Long Ge by clicking on the avatar, and I will be monitoring the market 24 hours a day in the village to provide accurate strategies, don't wait until the price has risen to ask if you can chase it!#山寨币市场回暖


