If your funds are within 50,000 and you want to achieve quick success in the cryptocurrency circle through short-term trading, then please read this post carefully. After reading it, you will surely gain a sudden understanding of the essence of short-term trading!
I was born in 1987, and I've been in the cryptocurrency circle for 11 years, fully trading cryptocurrencies to support my family for 5 years!
Not choosing finance or computer science as my major in university is one of my biggest regrets in life. I started to get in touch with Bitcoin and blockchain online at an early age, and the captivating candlestick charts and disruptive ideas fascinated me. With infinite longing for the crypto world, I participated in trading early on, thus beginning this journey full of challenges and opportunities.
Like most newcomers, I was initially fascinated by various technical indicators and on-chain data, constantly backtesting in an attempt to find the "holy grail." I was also keen on buying "cheap" altcoins or "value coins" that had already fallen by 90% or more, believing they had a higher "margin of safety." However, harsh reality has taught me that these initial market perceptions are largely incorrect and dangerous.
Only later did I painfully understand: If you want to make quick and relatively controllable profits in the cryptocurrency market, which is highly volatile and operates 24/7, focusing on short-term hot trends is almost the only viable path (for small funds). The core of short-term trading is to identify the mainstream narrative track of the market and accurately grasp the emotional cycle*. The mainstream narrative breeds leading coins, and the crazy rise of leading coins in turn strengthens and spreads the narrative. And the ones that contribute the most to your account and are the most efficient are often those that capture the leading coins in those stages*. In a violent bull market, they provide the strongest explosive power; in local rebounds, they are often the first to start and are relatively "resistant to declines" (note: the "safety" of the cryptocurrency market is relative!). In 21 years, I also captured the fastest main upward wave in my career in leading stocks such as SOL and MATIC. **
The same coin, bought during different market sentiment phases and narrative cycles, can yield wildly different results! The sentiment cycle tells you when to take a bold plunge, even using leverage (caution!); when to hold back, even going short (if you can); and when to exit the market entirely and wait and see. The prevailing market narrative tells you where capital is heading (AI, MEME, new public chains, or Layer 2?). This is the correct, top-down approach to speculation. Unfortunately, many investors get it wrong, going against the trend and defying market sentiment, only to be ruthlessly harvested.
There is a quote that really impressed me: “If you don’t occupy the cognitive heights of your mind, FUD (fear, uncertainty, doubt) and FOMO (fear of missing out) will take over.”
Today, I'm sharing with you my short-term cryptocurrency trading strategy and strategy. It's the core logic that keeps me surviving and profiting in a market that's even more brutal, fast-paced, and unpredictable than the stock market. If you can take the time to understand, practice, and ultimately internalize it, your understanding of cryptocurrency trading will undoubtedly change dramatically!
Keeping up with Bitcoin's ups and downs
Bitcoin is a bellwether for the cryptocurrency world, influencing the rise and fall of most smaller cryptocurrencies. While cryptocurrencies with strong conceptual logic, such as Ethereum, occasionally break away from Bitcoin's unilateral trend, other altcoins rarely escape Bitcoin's control. Therefore, closely monitoring Bitcoin's trading fluctuations can provide important insights for trading other cryptocurrencies.
Seize the golden moment of trading
The period between midnight and 1:00 AM is a special time for cryptocurrency trading, prone to the "gold ray" phenomenon. This is a period of low trading volume in much of the world, and all sorts of unexpected situations can occur. For those looking to buy low or sell high, consider placing a buy order at a very low price before bed, or a sell order at an ideal profit-making price. You might even be lucky enough to land a deal.
Follow USDT price trends
Generally speaking, USDT and Bitcoin move in opposite directions. When you see a rapid rise in USDT, be wary of a potential Bitcoin plunge. Conversely, when Bitcoin rises, it's often a prime time to buy USDT. Understanding the relationship between the two price trends can help you make better trading decisions.
Follow financial news from central banks around the world
The volatility in the cryptocurrency market is deeply influenced by the attitudes of various governments towards Bitcoin. If governments take crackdowns or control measures, the market is likely to fall. Furthermore, changes in US financial policies, such as the recent rumors of a rich tax on the wealthy, will also have a significant impact on the cryptocurrency market. Therefore, daily monitoring of financial news from various central banks is essential for cryptocurrency traders.
Seize the key time period
6:00 AM to 8:00 AM is a key time to determine buying and selling, and it can also be used to determine the day's ups and downs. If the stock price has been falling from midnight to 6:00 AM and continues to fall during this period, then this is a good time to buy or cover your position, and there is a high probability that the stock price will rise that day; if the stock price has been rising from midnight to 6:00 AM and continues to rise during this period, then this is a good time to sell, and there is a high probability that the stock price will fall that day.
Watch out for Black Friday
There is a saying in the cryptocurrency world that “Black Friday” means that Friday is the day when the market often experiences sharp drops, but there are also times when the market moves sideways or rises sharply. Although this is not a particularly accurate prediction, it is still necessary to pay attention to the news.
Focus on transaction volume
Trading volume is the lifeblood of digital currencies. For cryptocurrencies with a guaranteed trading volume, don't worry if the price drops. Patiently holding on will likely pay you back. This could take as little as a week or as long as a month. If you have extra cash, you can add to your position in batches to lower your average cost, which will help you recoup your investment faster. If you don't have extra cash, then wait patiently; you'll likely not be disappointed.
Avoid frequent trading
For the same cryptocurrency, long-term spot trading often yields significantly greater returns than frequent trading, which greatly tests investors' patience. Frequent trading not only increases transaction costs but also easily leads to incorrect decisions due to emotional fluctuations.
Application of K-line moving average
In cryptocurrency trading, K-line analysis has some applicability, but not all indicators are equally useful. While K-line analysis isn't 100% accurate, and many people find it insignificant after learning it, the experience of many experts shows that it plays a key role in analyzing long-term price trends. Regardless of where the price of a currency goes, it will be reflected in trading, and we can use these techniques to understand its direction.
Moving Average Rule: Building a Trend Framework
In the 1-hour trend cycle, we can use three EMAs to construct a trend framework: the fast line (21) represents short-term momentum, the middle line (55) reflects medium-term direction, and the slow line (144) defines the long-term trend. When the moving averages show a bullish pattern of "fast > middle > slow," the market is in a strong uptrend; otherwise, it is dominated by bearishness. This arrangement effectively filters out noise; even if the moving averages reverse, the trend direction remains valid as long as the order remains unchanged.
However, moving averages have the drawback of lag. We can compensate for this by using a "trend candlestick confirmation" mechanism: when the price breaks through the moving average, wait for a candlestick with the same direction (such as a long bullish candlestick in a bullish trend) to appear on the 15-minute chart before entering the market. This prevents false breakouts while allowing us to capture trend acceleration. The parameter selection is also logical: a 21-period corresponds to monthly fluctuations, a 55-period aligns with quarterly trends, and a 144-period resonates with the annual line. This combination has consistently achieved a win rate of over 65% in historical backtesting of forex, futures, and other products, with a profit-loss ratio of 1:2.3.
The support and resistance of the moving average
The moving averages of important parameters have support and pressure effects. When the market tests the moving averages of important parameters from bottom to top, the market will be under pressure, and there is an expectation of a pullback or a downward reversal; when the market tests the moving averages of important parameters from top to bottom, the market will gain support, and there is an expectation of a pullback or an upward reversal. In actual practice, we can choose the moving averages of these important parameters and combine them with some reversal structures or patterns for trading.
For example, in the ETH/USDT 1-hour chart in May 2024, the EMA 21/55/144 showed a bullish pattern, but the price retraced to the 55-day moving average three times without breaking. Looking at the 15-minute chart at this time, we found that each retracement was accompanied by shrinking trading volume and a doji pattern, which is a typical "trend continuation signal." Ultimately, ETH broke through the previous high, with a single wave increase of 37%.
Moving average crossover to determine trend and entry timing
Moving average crossovers are also a commonly used analytical method. Two moving averages are added to the chart. The one with the smaller parameter is the fast line, which changes quickly; the one with the larger parameter is the slow line, which changes slowly. Moving average crossovers are used in two main ways: First, to determine direction. When the slow line breaks through the fast line upward, it is a bullish trend confirmation; when the slow line breaks through the fast line downward, it is a bearish trend confirmation. Second, to determine entry signals. When the slow line breaks through the fast line upward, it is a long position entry signal; when the slow line breaks through the fast line downward, it is a short position entry signal.
For example, in a 1-hour K-line chart of spot gold, if the K-line crosses below the moving average, the trend is considered bearish. Wait for the K-line to retest the moving average, gain resistance, and then break through the previous low again. Then, enter a short position and set the stop-loss at the high point of the pullback. After the first order is placed, if the market falls for a period of time and then retests the moving average, gaining resistance, and breaks through the low again, you can enter the market again to increase your position.
Combining Moving Averages with Other Indicators
Moving averages can be combined with indicators like the golden ratio and MACD to improve the accuracy of trading decisions. For example, after a moving average golden cross or dead cross confirms a direction, the market has typically already moved for a while, and at this point, the profit-loss ratio may be unreasonable. By combining the golden ratio and finding the key position of a trend pullback before entering the market, you can reduce your stop-loss space and achieve a more reasonable profit-loss ratio.
For example, when the market tests the moving average and there is an expectation of a reversal, if the MACD also shows a divergence pattern, it forms a resonance of market reversal. You can enter the market with a small-scale moving average. This way, the stop-loss space is small, and if the market moves out, the profit and loss ratio will be more ideal.
Trading is a long-term journey. To achieve success in the cryptocurrency world, you must abide by the rules and build your own trading system. I hope this cryptocurrency trading strategy can provide a useful reference for everyone in the cryptocurrency world. I wish everyone can achieve the desired returns.
Here comes the key point! Next, I will share with you the application of K-line moving average. We all know the importance of K-line in the stock market.
Then in the currency circle, these K-line theories are only applicable to a part of the currency circle, and not all indicator analysis is applicable in the currency circle.
Although the accuracy of K-line technology is not 100%, and even a lot of K-line knowledge we learn is not very useful,
In fact, according to the experience of many experts, K-line technology still plays a key role in the long-term analysis of the price trend of the currency.
No matter what direction the currency price will go, it will be reflected in the transaction. We can use these technologies to understand
The trend of currency prices and K-line show the high probability, which can guide you to a bright path when you are confused.
Without further ado, let’s get to the point.
The biggest taboo in the cryptocurrency circle: cryptocurrency traders don’t understand the K-line chart. This article will help you easily understand the K-line chart.
There are many people who enter the cryptocurrency circle and speculate on it blindly, hoping to make a fortune blindly, and they cannot understand the K-line chart. In fact, the biggest taboo in the cryptocurrency circle is not understanding the K-line chart. Now let’s talk about the K-line trend chart of the cryptocurrency circle.
K-line: also known as Yin-Yang line or Yin-Yang candlestick. The specific meaning is shown in the figure below:
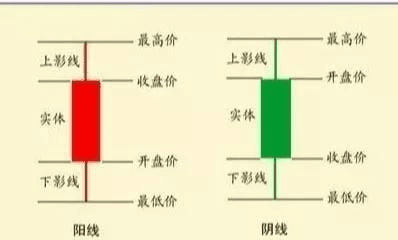
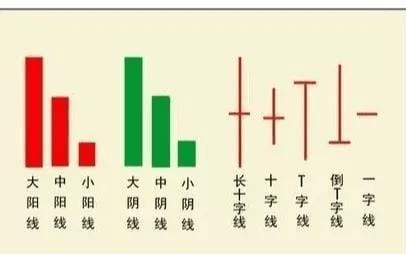
K-line can be divided into three types based on its shape: positive line, negative line and same price line.
There are three types of Yang lines: large, medium, and small. There are three types of Yin lines: large, medium, and small. When both are at the same price level, it means the closing price is equal to the opening price, a special form of K-line, such as a doji or T-line, at the same price level.
K-line can be divided into daily K-line, weekly K-line, monthly K-line, and annual K-line based on time, and the trading time within a day can be divided into several equal parts, such as 5-minute K-line, 15-minute K-line, 30-minute K-line, 60-minute K-line, etc.
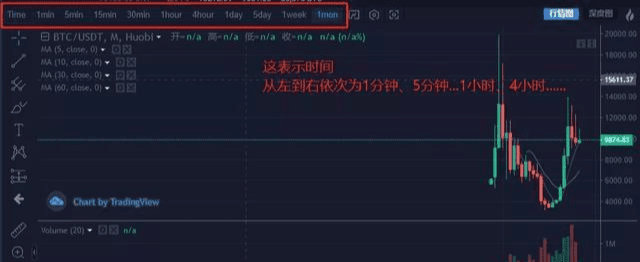
These K-lines have different functions. For example, the daily K-line reflects the short-term trend of the currency price. The weekly K-line, monthly K-line, and annual K-line reflect the medium- and long-term trend of the currency price. The 5-minute, 15-minute, 30-minute, and 60-minute K-lines reflect the ultra-short-term trend of the currency price.
Their drawing methods are similar. For example, for the weekly K-line, as long as you find Monday's opening price, Friday's closing price, the highest price and the lowest price of the week, you can draw it. The time marked on the weekly K-line on the computer is the time of the closing price.
Monthly K-line: Look at the long-term trend, allowing you to see the upward or downward trend of the market from a large time period.
(Note: The 5-month moving average on the monthly K-line is equivalent to the 100-day moving average on the daily K-line, and is close to the 120-day moving average on the semiannual line.)
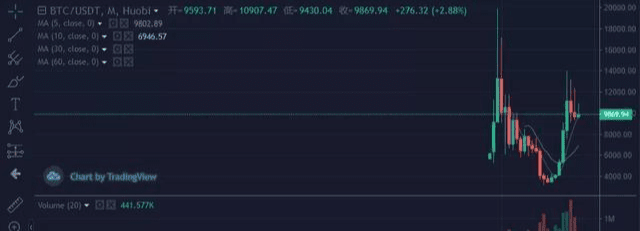
For example: When the monthly K-line's May and October moving averages diverge or form a death cross, it often means that a large downward trend has begun. If you haven't set a stop-loss at this time, you must resolutely cut your position and exit the market! On the contrary, it means that a large upward trend has begun. If you haven't opened a position at this time, you should buy coins to enter the market. Weekly K-line: It is the most practical K-line that must be read every day to observe the medium-term trend. (Note: The 5-week moving average on the weekly K-line is equivalent to the 25-day moving average on the daily K-line, and the 10-week moving average is equivalent to the 50-day moving average on the daily K-line)
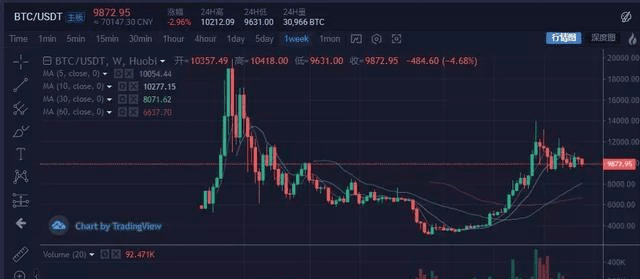
For example: When the 5-week and 10-week moving averages bend upward and form a golden cross, it means that the market or individual currency has entered a strong state and there will be a good market trend.
On the contrary, it means that the market or individual coins have entered a weak state, and there will often be a large downward trend. Therefore, it is necessary to stop loss and exit the market in time, and no longer have a fluke mentality.
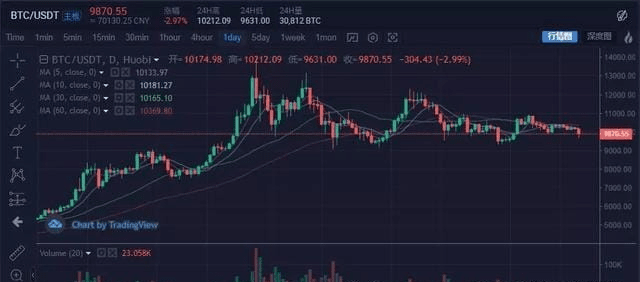
Daily K-line: It is the most common and practical K-line chart that is used to look at short-term trends.
For example, using short-, medium-, and long-term moving averages can easily determine the strength of the market or individual coins. Using the daily MACD, combined with the moving average and trading volume, can help determine the entry point for buying coins. When the market is strong, the daily K-line chart can also help determine the selling point.
Minute K-line: look at the ultra-short-term trend.
There are 60, 30, and 15 minute K-line charts, which can help you see the details of the decline or rise that cannot be seen on the weekly and daily K-line charts. It is a must-see K-line chart for short-term speculation.
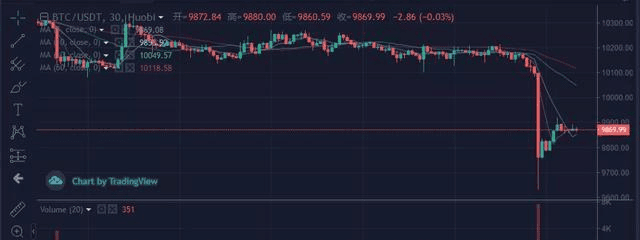
The 10-hour moving average of the 60-minute K-line is equivalent to the 3-day moving average of the daily line, and the 20-hour moving average is equivalent to the 5-day moving average of the daily line.
Therefore, it is better to refer to the 60-minute and 30-minute candlestick charts when operating in the short term.
When you have a million yuan in capital, the world truly changes: Even without leverage, a 20% increase in spot prices translates to 200,000 yuan, which is already the annual ceiling for many people. More importantly, if you've managed to build a million yuan from tens of thousands, you've already mastered the logic of making money and have developed a calm mindset. Everything else is just a matter of copying and pasting.
Don't keep saying "I want to make tens of millions or even hundreds of millions" all the time. Start with your own pocket first. Bragging is only good for you; money is earned bit by bit.
The key to trading is being able to distinguish between big and small opportunities: you can't always slack off with a light position, nor can you risk your life with a heavy position every day. Practice your skills with small trades during the day, and when the big opportunity comes, pull out the "Italian gun" - rolling positions are prepared for such moments.
If you can roll it over three or four times in your lifetime, it is not difficult to go from 0 to tens of millions, which is enough for ordinary people to step into the threshold of rich people.
So when is the right time to roll over? There are three situations, and the rest are all abandoned:
1. When the market is sideways for a long time and the volatility drops to a very low level, it is time to choose a direction;
2. In a bull market, if there is a sudden drop after a big rise, it is time to buy at the bottom;
3. When the price breaks through a major weekly resistance level (or falls below a major support level), the trend is about to change.
First, understand what rolling a position is: In a trending market, when you make money using leverage, the actual leverage of your position will become lower. At this time, you can increase your position to allow the profits to continue rolling. This is called rolling a position.
How to do it specifically?
- Add to your position when you make a profit: Buy when you have made money, but make sure your holding cost has dropped first; don’t add to your position blindly.
- Base position + T-trading: Divide your funds into several portions, holding onto one portion (the base position) and buying low and selling high. The proportions you choose depend on your risk tolerance; rolling over half of your position or even 30% of your base position is fine. The key is to reduce costs and increase returns.
There are only two “good times” to increase your position:
1. If the trend suddenly breaks through the convergence range, increase your position to take advantage of the main upward trend, and sell the added position as soon as you make a profit;
2. When the trend pulls back to near the moving average, buy in batches and wait for the next wave.
Here’s another “dumb trick” that I used to make a little money and I almost never lost money:
1. When the market plummets, your coin will drop a little bit - this means that there are market makers supporting the market. Hold on, and you will make money sooner or later.
2. For beginners, look at the 5-day moving average for short-term trading. Hold on to the 5-day moving average if it is above the line, and sell if it falls below it. For medium-term trading, look at the 20-day moving average. The same principle applies. It is simple and direct.
3. When the main uptrend arrives, buy decisively even if there is no significant volume increase. Hold on if there is a significant volume increase, and also hold on if there is a decrease in volume but the trend is not broken. If there is a significant volume decrease and the trend is broken, reduce your position immediately.
4. After buying short-term stocks, if there is no movement for three days, sell them if you can; if the stock drops by 5%, don’t hesitate to stop loss;
5. A coin has fallen 50% from its high and has been falling for 8 consecutive days – it is oversold and a rebound may come at any time, so you can give it a try;
6. Buy leading coins: They rise most rapidly and are the most resilient when they fall. Don't buy junk coins just because they've fallen too much, and don't be afraid to buy leading coins just because they've risen too much. The key to leading coins is to "buy high, sell even higher."
7. Follow the trend. The lower the purchase price, the better. The most important thing is to buy at the right price. Don't try to guess the bottom when the price is falling. Sell any coins that are not performing well. The trend is more important than anything else.
8. Don't get carried away by making a few bucks; sustained profitability is the real skill. When reviewing your trades, ask yourself: Was this luck or skill? Building a trading system that you can maintain is better than anything else.
9. Don't trade if you're not sure. Short selling is also a strategy. When trading, think about protecting your capital first, then making money. What matters is not the number of trades, but the success rate.
The "wealth code" of long-term trends:
- Halving cycle: 180 days before Bitcoin halving, buy BTC, BCH in advance and get them 30 days after the halving;
- Follow up the leader's rise: If the leader has risen by 200%, look for the second tier of the same sector that has risen less (less than 50%);
- Three technical verifications: weekly MACD golden cross + daily line breaking through the box + hourly line with large volume, which is a golden buying point;
- Institutional holdings: Large addresses have been buying on Glassnode, and the on-chain transaction volume has also surged, which is a start-up signal;
- Regular investment during a bear market: Invest 10% of your principal every month in blue chips like BTC and ETH. If you invest for 12 consecutive months, your returns will likely exceed 300%.
Risk Warning: These strategies should be adjusted according to real-time market conditions. Beginners should try them in a simulated trading session first. A single loss should not exceed 2% of your total capital. The market is not an ATM.
Finally, let me talk about the most important thing, which may seem unrelated to trading, but is actually the foundation:
Step outside the market and live a balanced life.
Just like in landscape paintings, the blank space is the essence. The time when a trader is not placing orders is more important than the time when he is placing orders.
If you don't manage your health, mentality, family, and interpersonal relationships well, trading problems are bound to arise. For example, if you lack a sense of security, you're prone to blindly carrying orders; if you want to attract attention, you might make reckless trades just to show off your trades.
Only by patching up the holes in your life can you truly relax and calm down when trading. Just like those great traders, they have no worries at home, no health problems, and only focus on the market when trading. How can they not win?
Copy down these 10 suggestions and stick them on your computer, and read them every day.
New traders are always fixated on "how to buy and sell." However, the correct process is 100 times more important than market analysis and trading techniques. This is also where veteran traders often stumble.
Think like a winner, trade like a winner, and handle your life like a winner
Again, if you don’t know what to do in a bull market, click on Aze’s avatar and follow him. Bull market spot planning, contract passwords, free sharing#山寨币市场回暖


