Navigating the world of cryptocurrency trading can be a daunting task, especially given the market's volatility. As a trader, using trading indicators is one of the most powerful ways to gain an edge.
These tools help you analyze market trends, understand price movements, and make informed decisions that can lead to more successful trades. In this article, we will explore the most effective indicators used in cryptocurrency trading and how they can enhance your strategy.
What are indicators in trading?
Trading indicators are mathematical formulas that allow you to visualize data on cryptocurrency charts. They help identify potential signals, trends, and momentum changes. Simply put, trading indicators provide insights into when market movements are likely to occur based on historical data such as price fluctuations and trading volume. This information helps traders understand current market conditions and predict future trends, particularly in the context of a market defined by volatility.
Indicators are crucial for removing emotions from the decision-making process. They provide data-driven objective insights that help traders avoid relying on intuition or personal biases. By using the right indicators, trends can be identified early, momentum changes can be discovered, and even reversals can be predicted. This enables traders to build a disciplined and informed strategy that adapts to the unique volatility of the cryptocurrency market.
Best Indicator List
Here are the ten most commonly used indicators in cryptocurrency trading:
Moving Average (MA);
Relative Strength Index (RSI);
Moving Average Convergence Divergence (MACD);
Bollinger Bands;
Fibonacci Retracement;
Stochastic Oscillator;
Ichimoku Cloud;
Parabolic SAR;
On-Balance Volume;
Average Directional Index (ADX).
Next, we will delve deeper into these indicators and explore how they can help you improve your trading strategy.
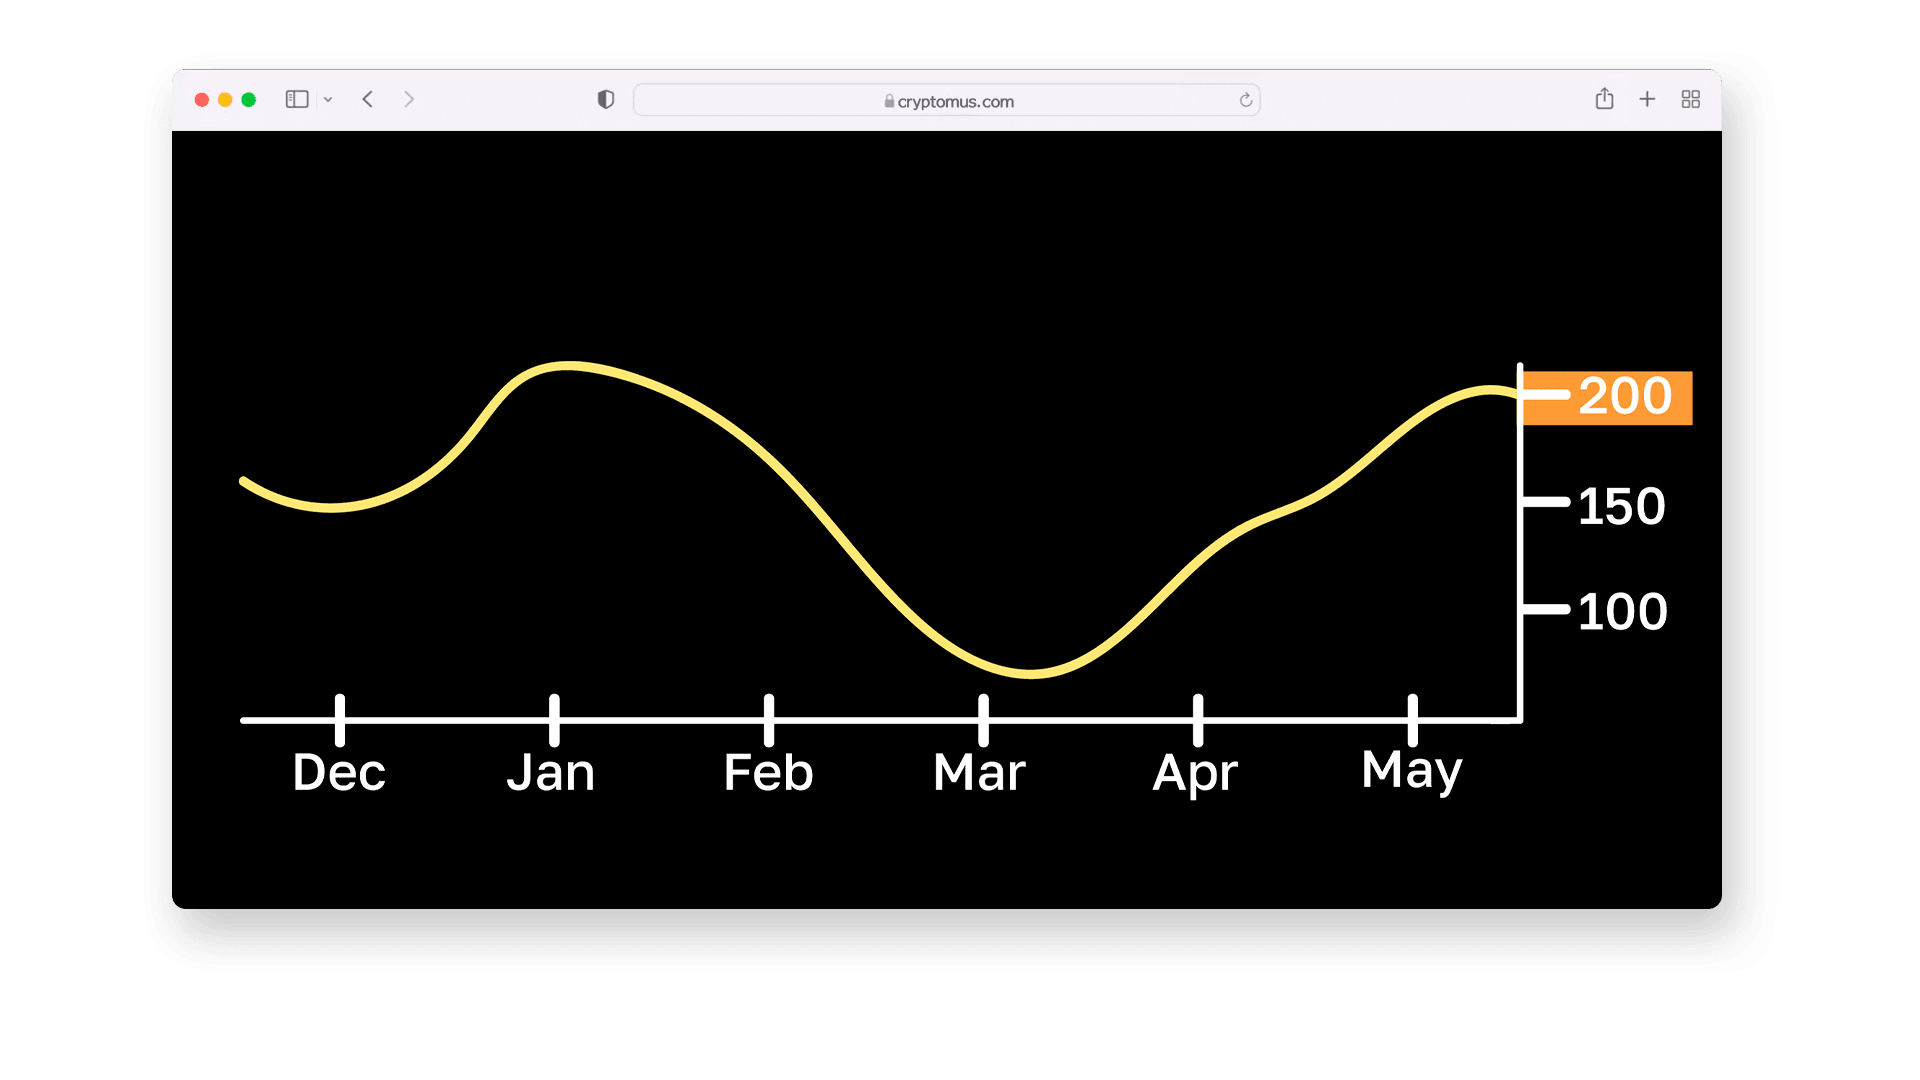
Moving Average (MA)
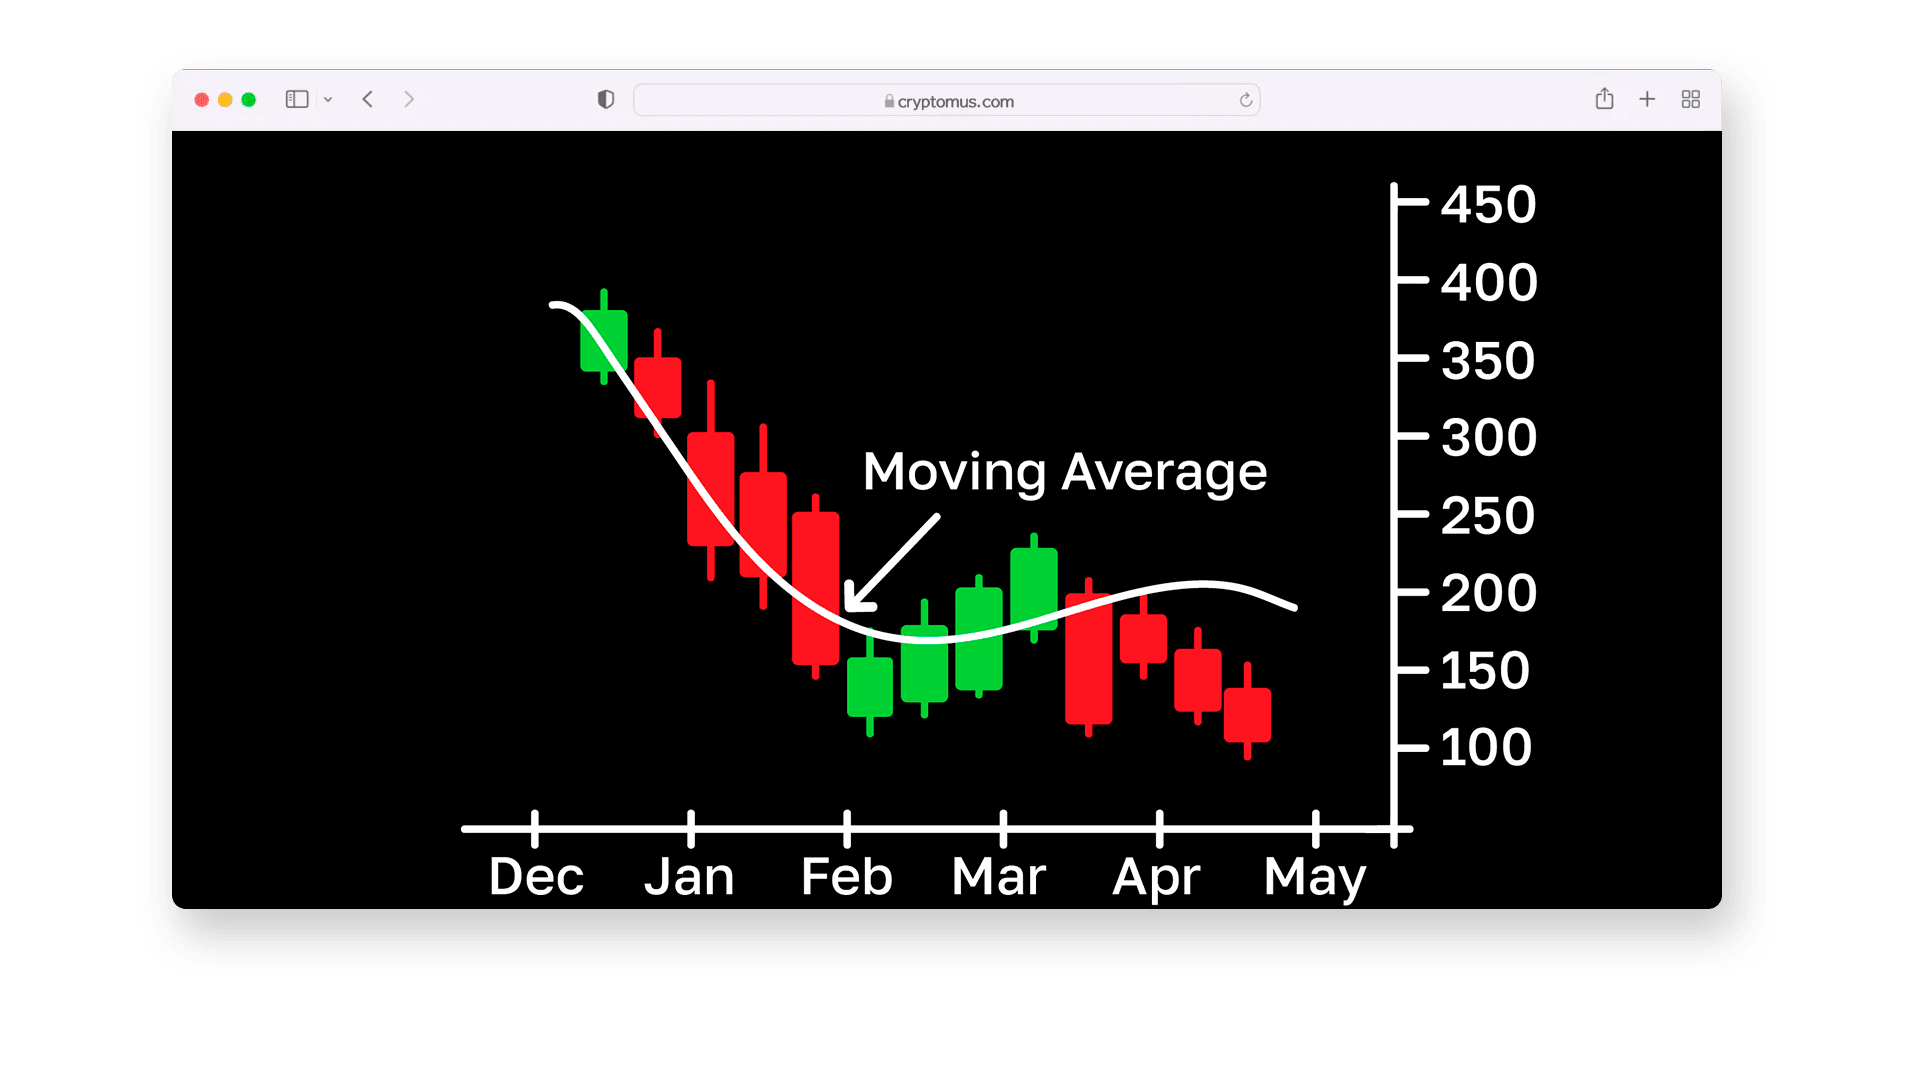
Moving Average (MA) is an indicator that smooths price fluctuations and helps identify major market trends.
The essence of MA is that it shows the direction of the market; if the price is above the MA, it may indicate an uptrend, while if below, it indicates a downtrend. Moving averages filter out random fluctuations and reveal the main trend. It is also used to confirm buy or sell signals, such as when the price breaks above the MA.
When analyzing the cryptocurrency market, the 50-day moving average (50 MA) and the 200-day moving average (200 MA) values are often used.
 The calculation of Moving Average (MA) is to divide the total price over the specified time period (n) by the number of periods. Here, 'n' represents the chosen time frame, and the result indicates the average price over that period.
Relative Strength Index (RSI)
Relative Strength Index (RSI) is an indicator that measures the speed and magnitude of price changes to identify whether the market is overbought or oversold.
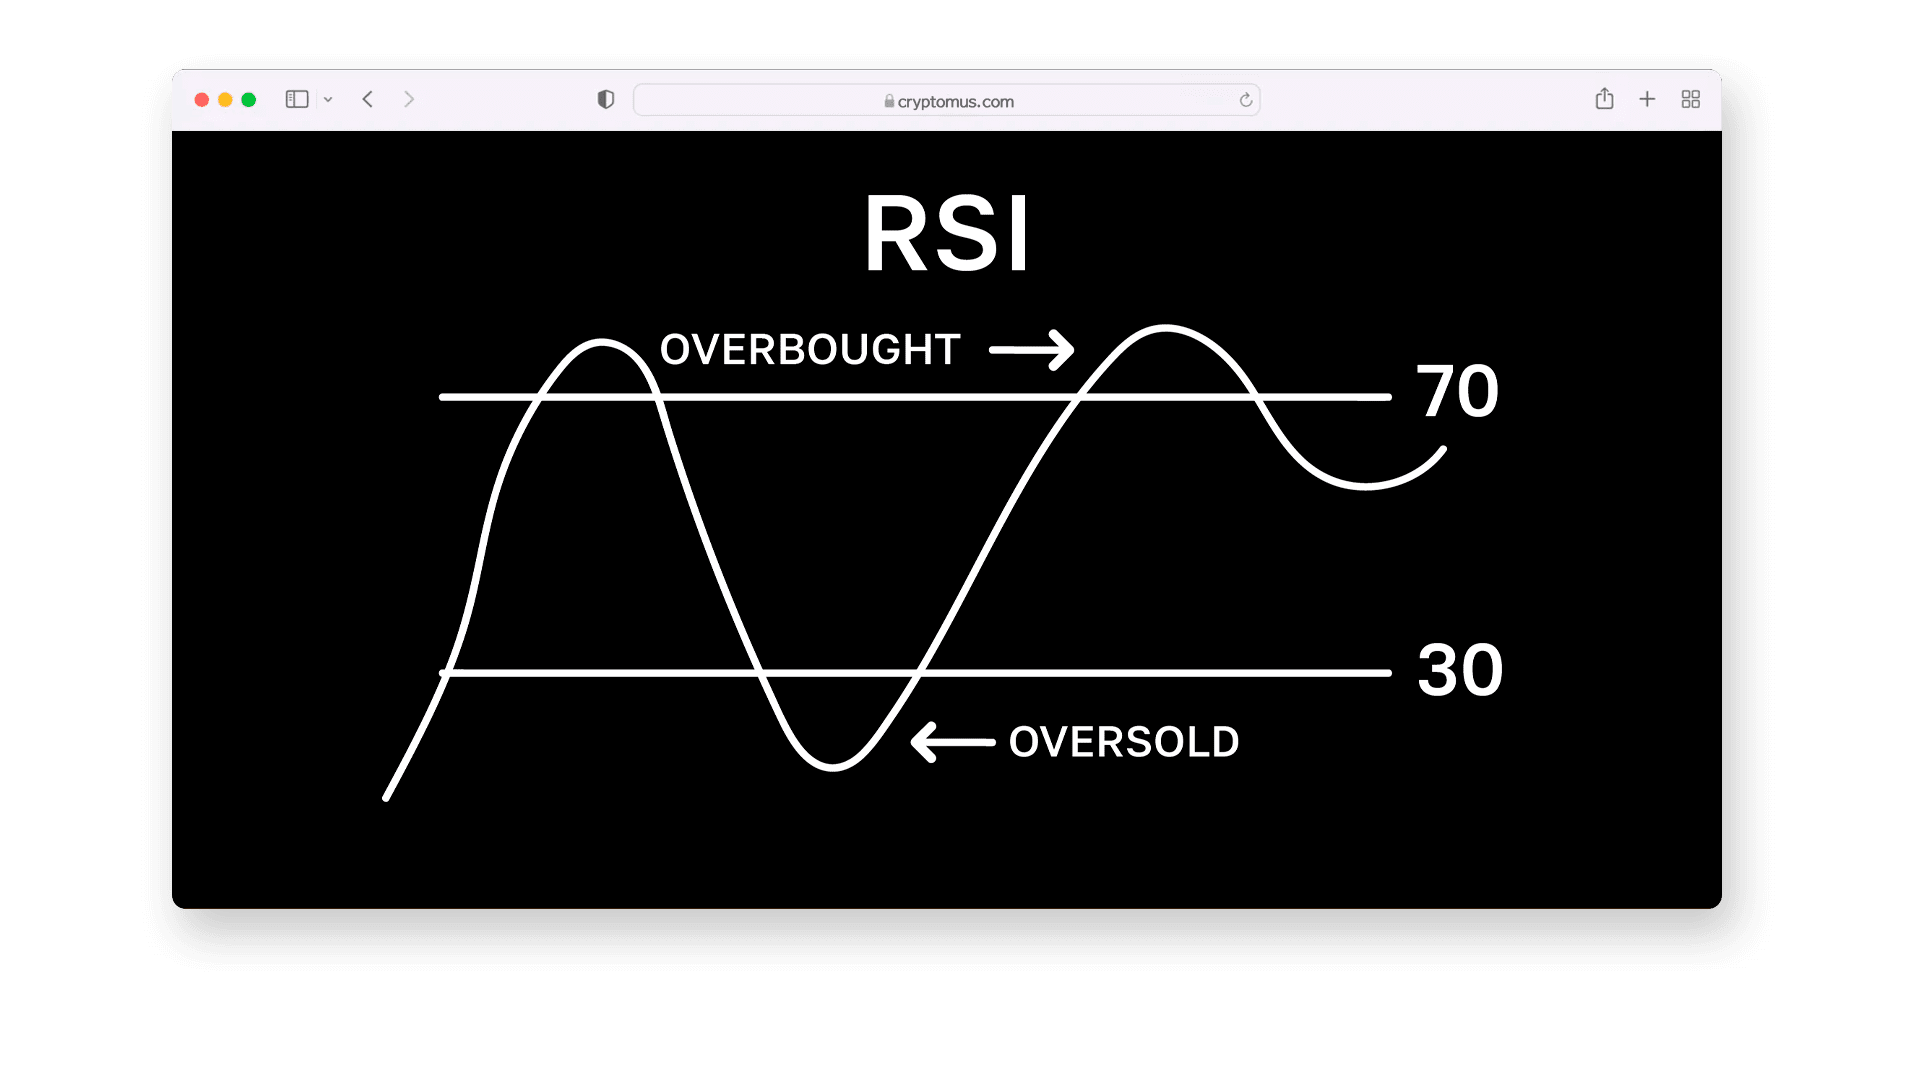 The essence of RSI is that it evaluates momentum; if the RSI value is above 70, it may indicate that the asset is overbought, which may lead to a price pullback, while an RSI below 30 suggests that the asset is oversold, which may lead to a price rebound. Therefore, RSI helps traders identify potential reversals or confirm trends by analyzing the strength of recent price movements.
When calculating RSI, the average gains and losses over the selected time period are compared. The formula assigns higher values to stronger upward movements and lower values to stronger downward movements, generating an index value between 0 and 100.
Moving Average Convergence Divergence (MACD)
Moving Average Convergence Divergence (MACD) is an indicator that shows the relationship between two moving averages of asset prices, used to identify potential trend changes and momentum.
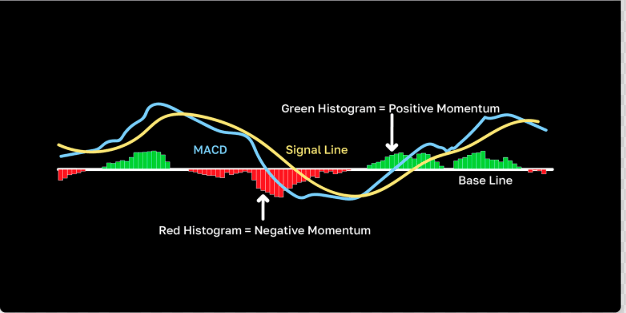
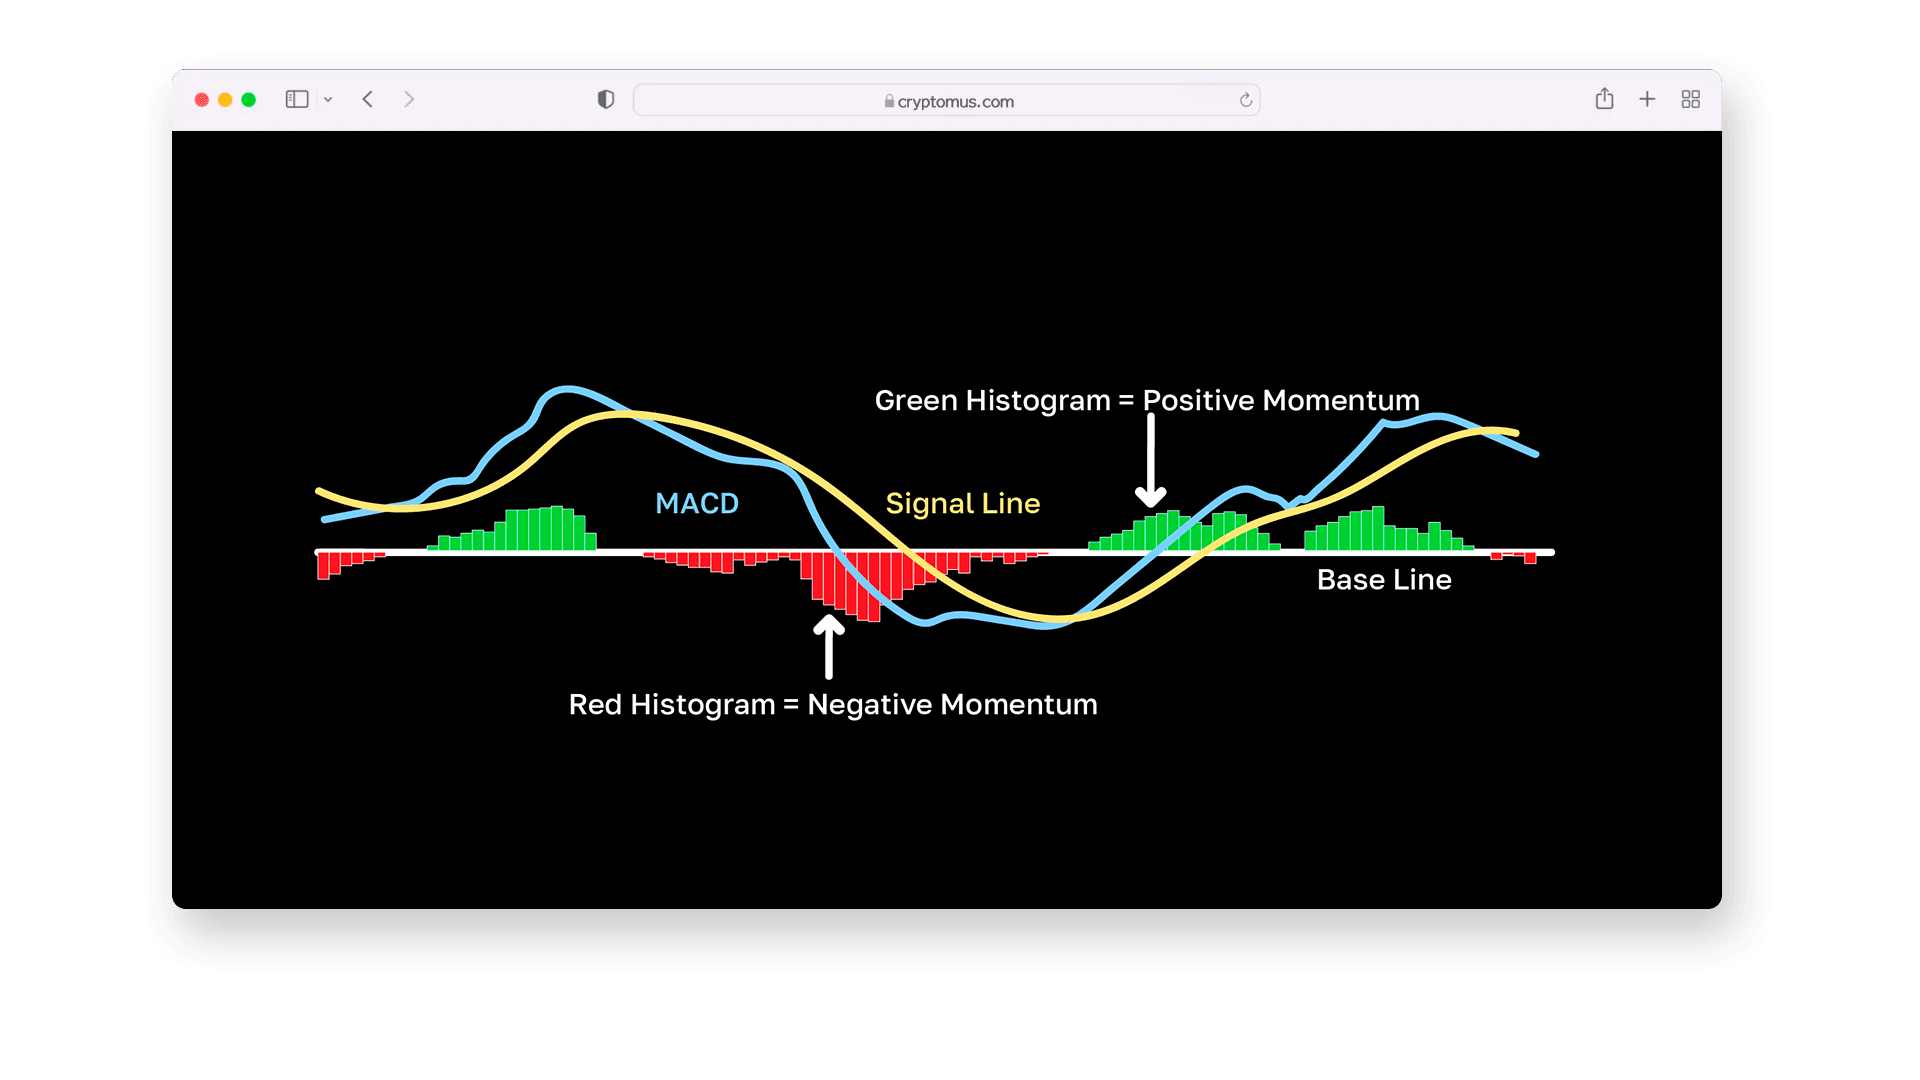 The essence of MACD is that it highlights signals when trends are strengthening or weakening. It consists of three components: the MACD line (the difference between two moving averages), the signal line (the moving average of the MACD line), and the histogram (the difference between the MACD line and the signal line). When the MACD line crosses above the signal line, it may generate a bullish signal, while crossing below may indicate a bearish signal. Traders typically use default settings of 12, 26, and 9 periods.
Bollinger Bands
Bollinger Bands are an indicator that measures price volatility using a moving average and two standard deviation lines, helping to identify potential overbought or oversold conditions.
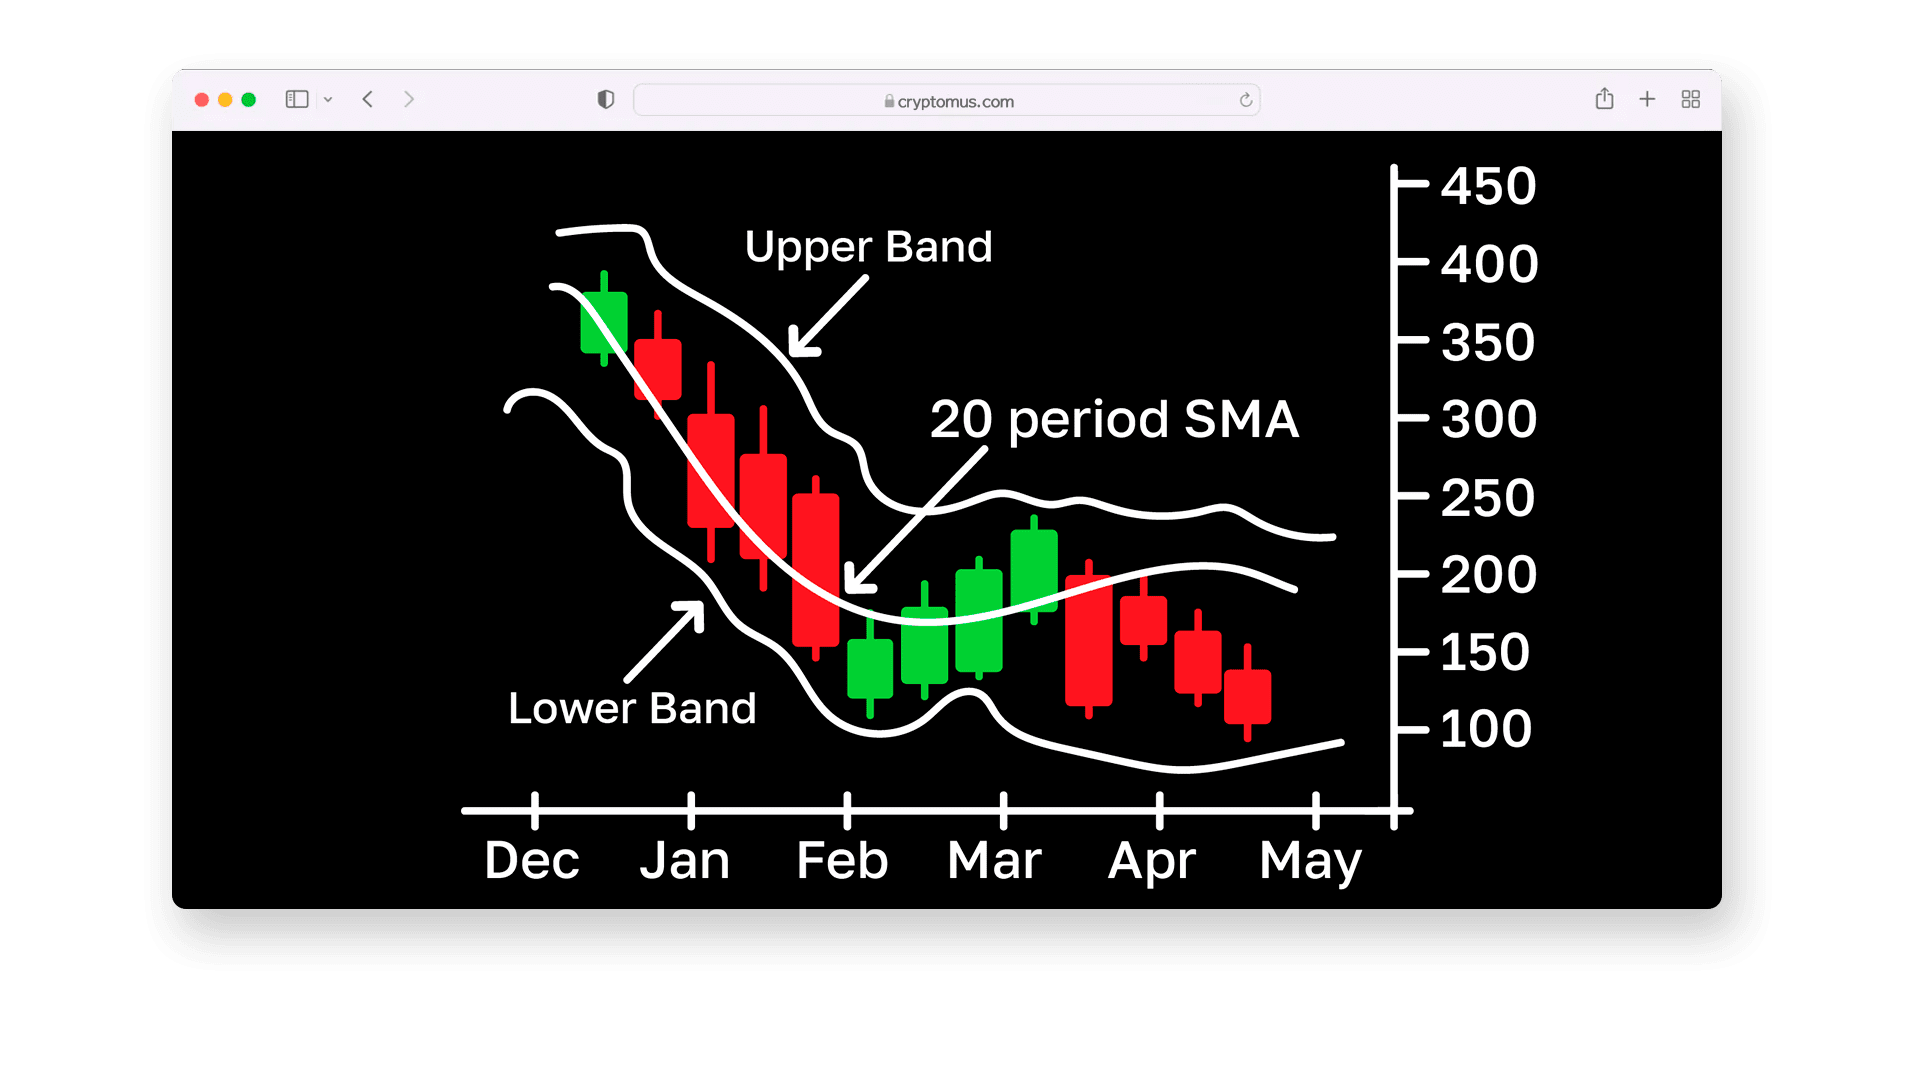 The essence of Bollinger Bands is that they adapt to market volatility. When the bandwidth widens, it indicates higher volatility; when it narrows, it indicates lower volatility. Prices near the upper band may indicate overbought conditions, while prices near the lower band may indicate oversold conditions.
Bollinger Bands consist of three lines: the middle line (simple moving average), the upper band (SMA plus a multiple of the standard deviation), and the lower band (SMA minus the same multiple of the standard deviation). Traders typically use a 20-period SMA with the bandwidth set to two standard deviations from the mean. This structure helps assess potential breakouts or reversals.
Fibonacci Retracement
Fibonacci retracement is a tool used to identify potential support and resistance levels by analyzing key price levels in a trend based on the Fibonacci sequence.
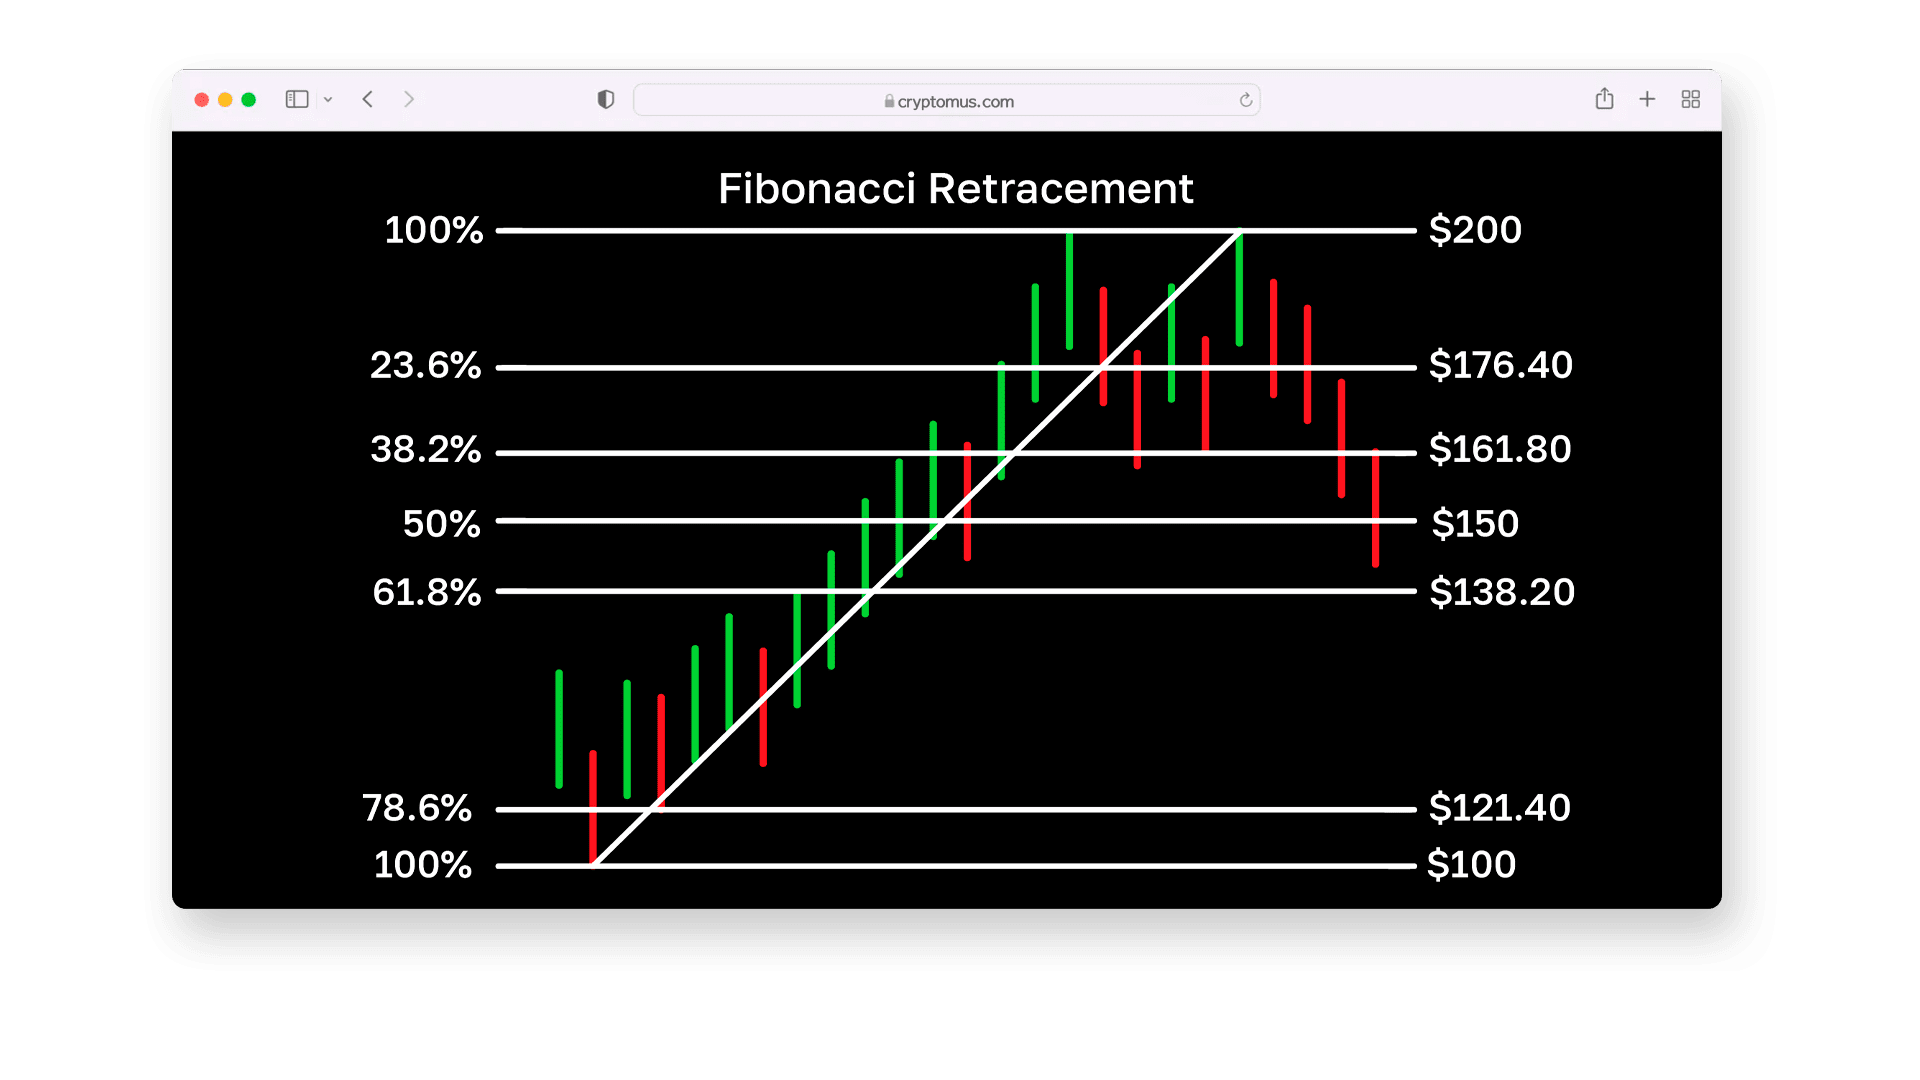 The essence of Fibonacci retracement is that it helps predict where prices may pause or reverse during a pullback. Common retracement levels are 23.6%, 38.2%, 50%, 61.8%, and 78.6%. These percentages indicate the extent to which the price has retraced from a previous move.
To use Fibonacci retracement, you need to identify a significant high and low point on the chart. The tool will plot horizontal lines at key retracement levels between these two points. Traders watch these levels for potential trend reversals, continuation signals, or breakout confirmations.
Stochastic Oscillator
The stochastic oscillator is an indicator that measures the current price of an asset relative to its price range, helping to identify overbought or oversold conditions.
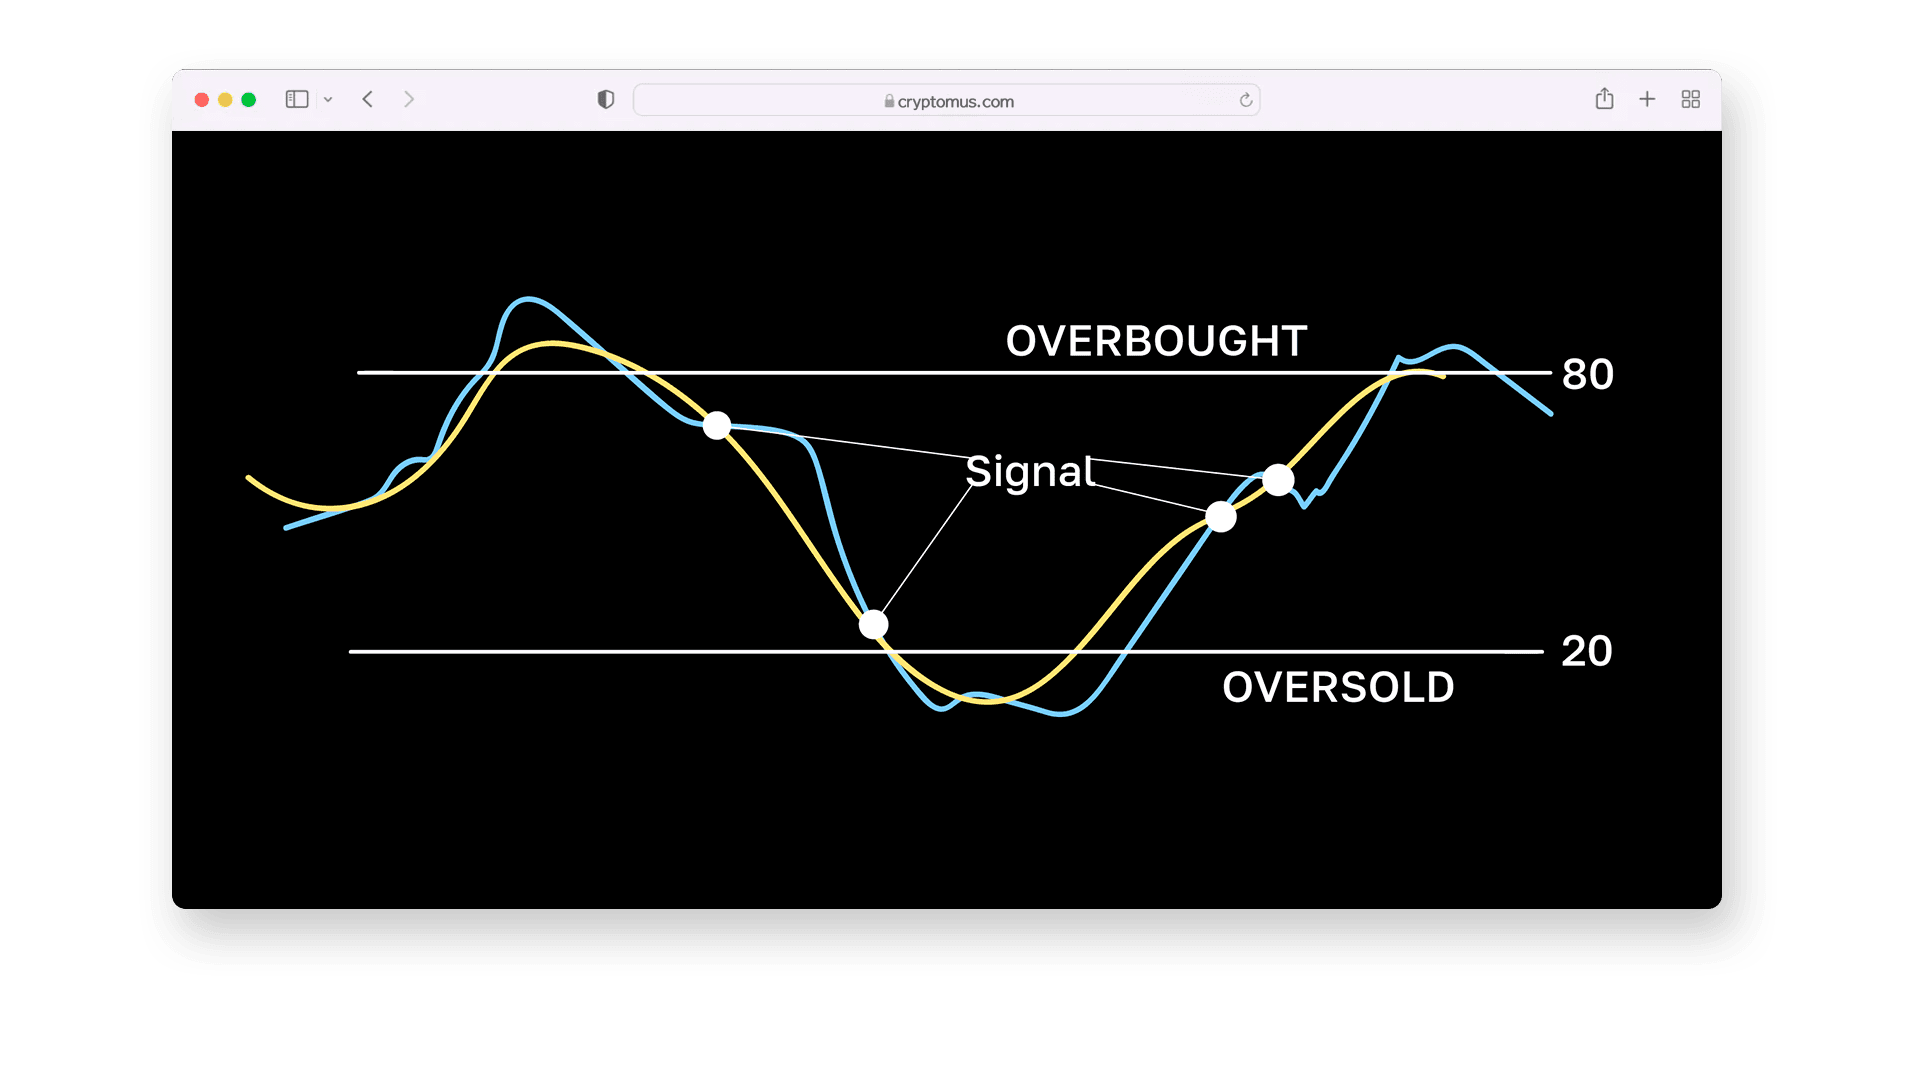 The essence of the stochastic oscillator is that it compares the closing price to the highest-lowest range over a set period. A value above 80 indicates that the asset is overbought, which may lead to a pullback, while a value below 20 suggests it is oversold, which may lead to a rebound.
The stochastic oscillator consists of two lines: %K (the main line) and %D (the moving average of %K). Traders use these lines to observe crossover signals that may indicate buying or selling opportunities. Default settings typically use 14 periods but can be adjusted based on specific trading strategies.
Ichimoku Cloud
Ichimoku Cloud is a comprehensive indicator that provides insights into trend direction, momentum, and potential support or resistance levels through multiple calculated lines.
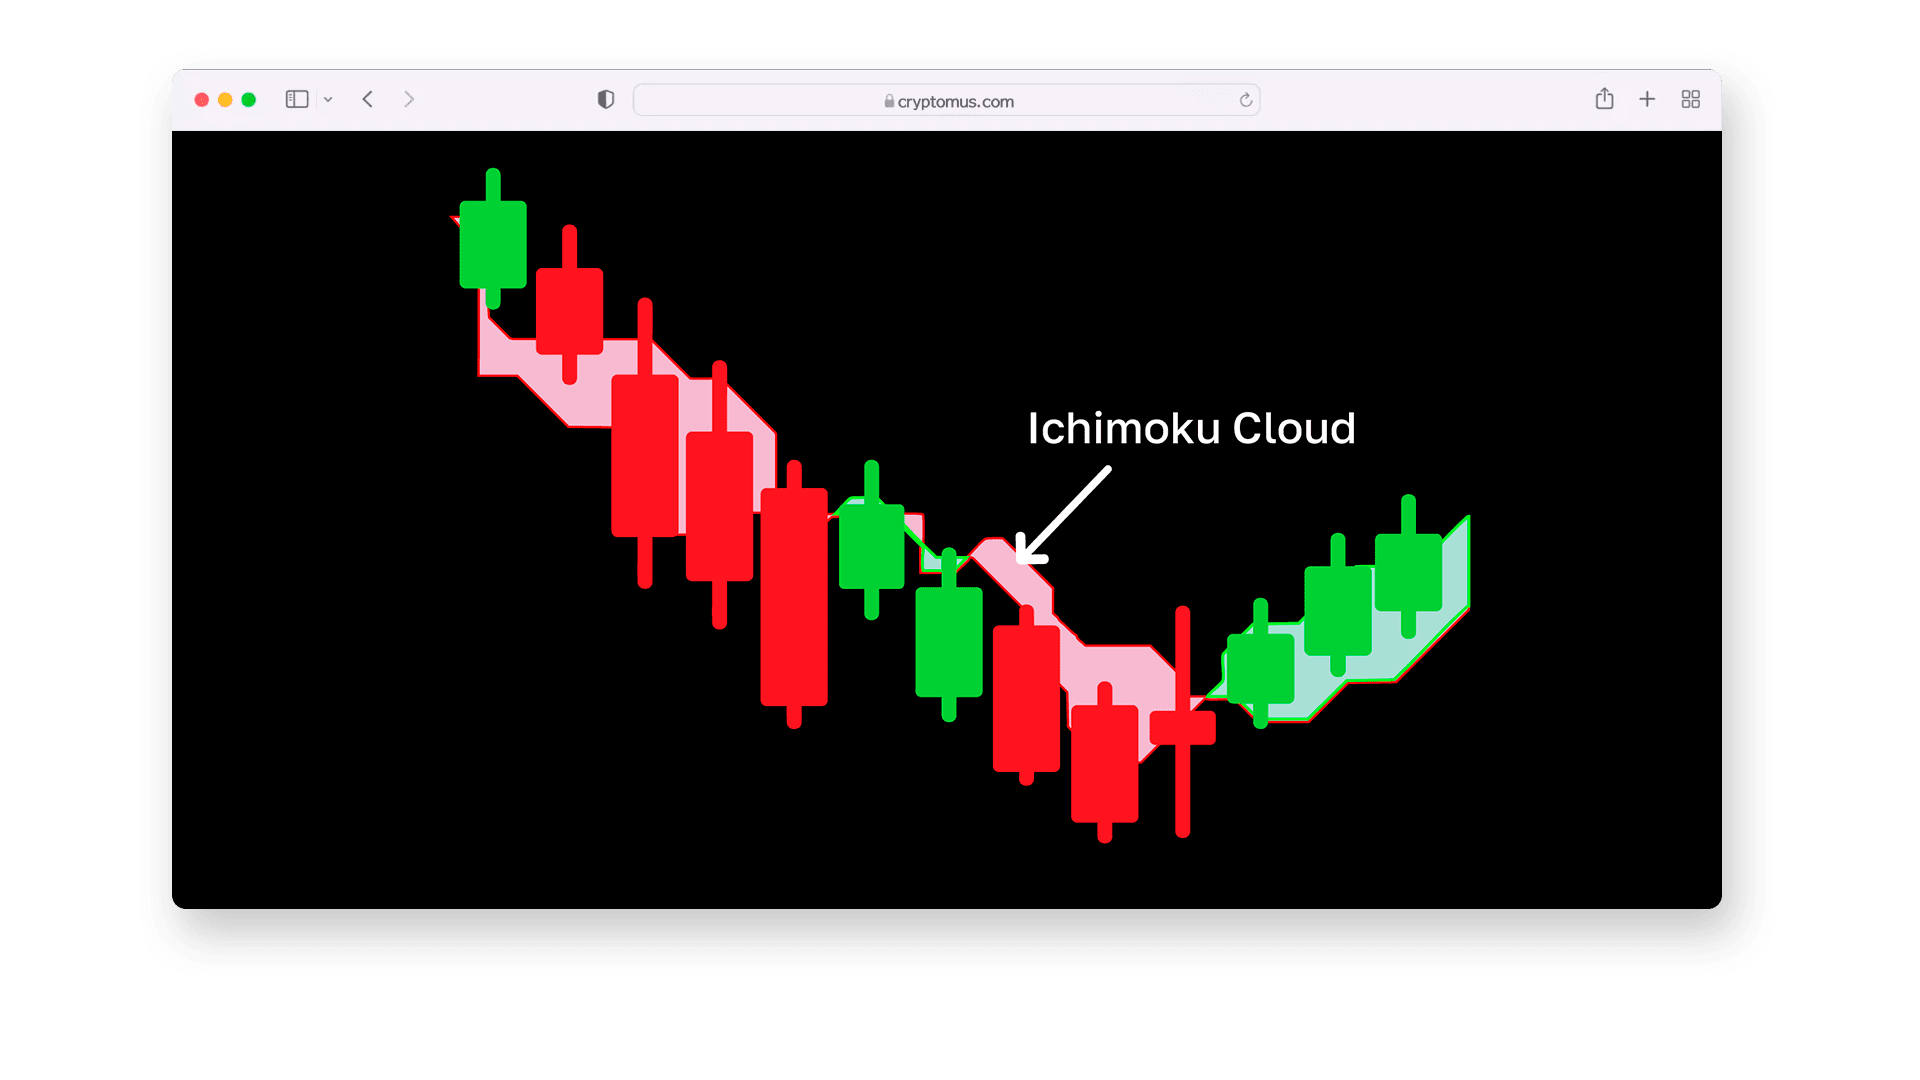 The essence of Ichimoku Cloud is that it provides a visual representation of market conditions. If the price is above the cloud, it indicates an uptrend; if below, it indicates a downtrend. The thickness of the cloud represents the strength of support or resistance, while the cross lines may suggest potential trend reversals.
Ichimoku Cloud consists of five lines: the Turning Line (short-term average), the Base Line (medium-term average), Leading Span A and B (cloud boundaries), and the Lagging Span (historical closing price). Traders commonly use it to confirm trends, assess momentum, and determine entry and exit points.
Parabolic SAR
Parabolic SAR (Stop and Reverse) is an indicator that helps identify the direction of the trend and potential reversal points.
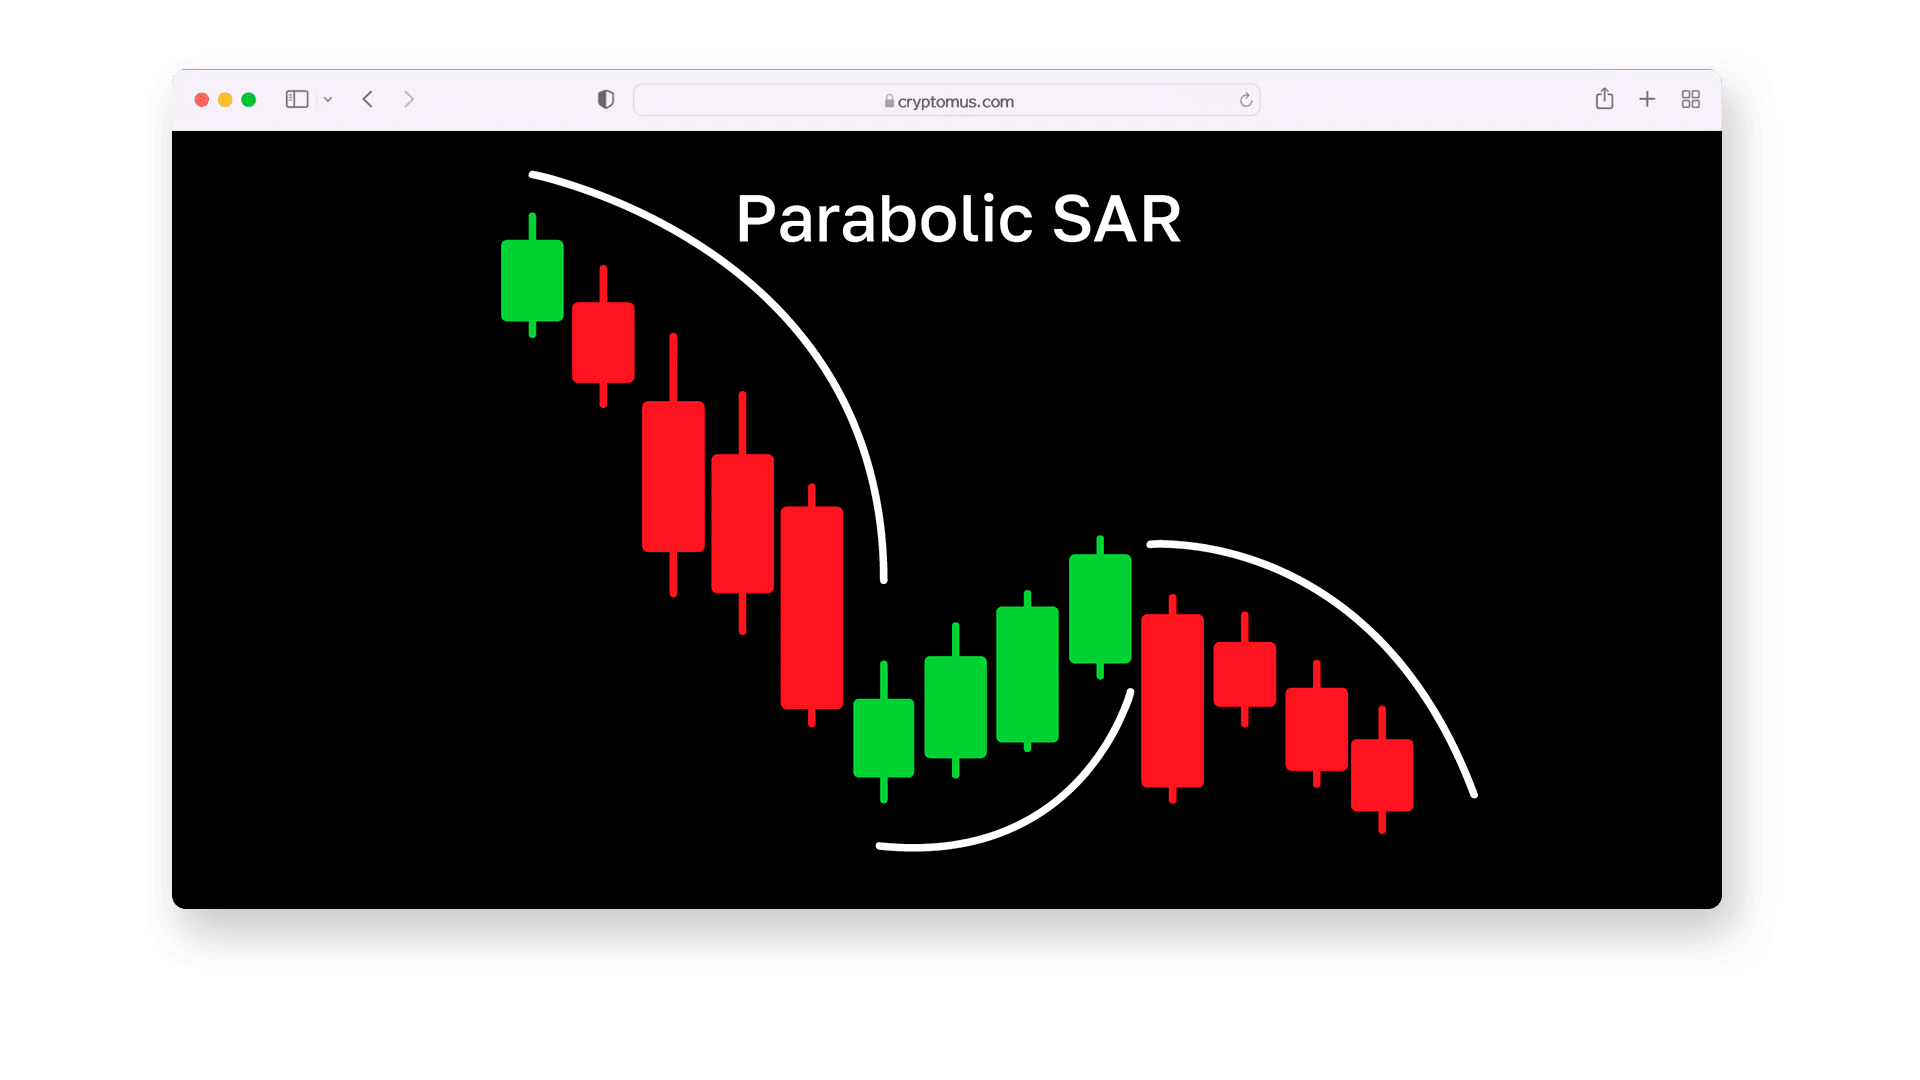 The essence of Parabolic SAR is that it indicates trend direction and potential reversal points by placing dots above or below the price. When the dots are below the price, it indicates an uptrend; when above, it indicates a downtrend. The switching of dot positions may signal a potential trend reversal.
This indicator calculates these points based on price and time, with points getting closer to the price as the trend strengthens. Traders often use Parabolic SAR to set trailing stop-loss points or in conjunction with other indicators to confirm trend direction.
On-Balance Volume
On-Balance Volume (OBV) is an indicator that measures buying and selling pressure by analyzing the relationship between volume changes and price movements.
 The essence of OBV is that it tracks whether volume is flowing into or out of an asset. If the price rises, today’s volume is added to OBV; if the price falls, the volume is subtracted. An increasing OBV indicates buying pressure, while a decreasing OBV indicates selling pressure.
Traders use OBV to confirm price trends or look for divergence. For example, if the price rises while OBV falls, it may indicate a weakening trend and a possible reversal.
Average Directional Index (ADX)
Average Directional Index (ADX) is an indicator that measures the strength of a trend, whether bullish or bearish.
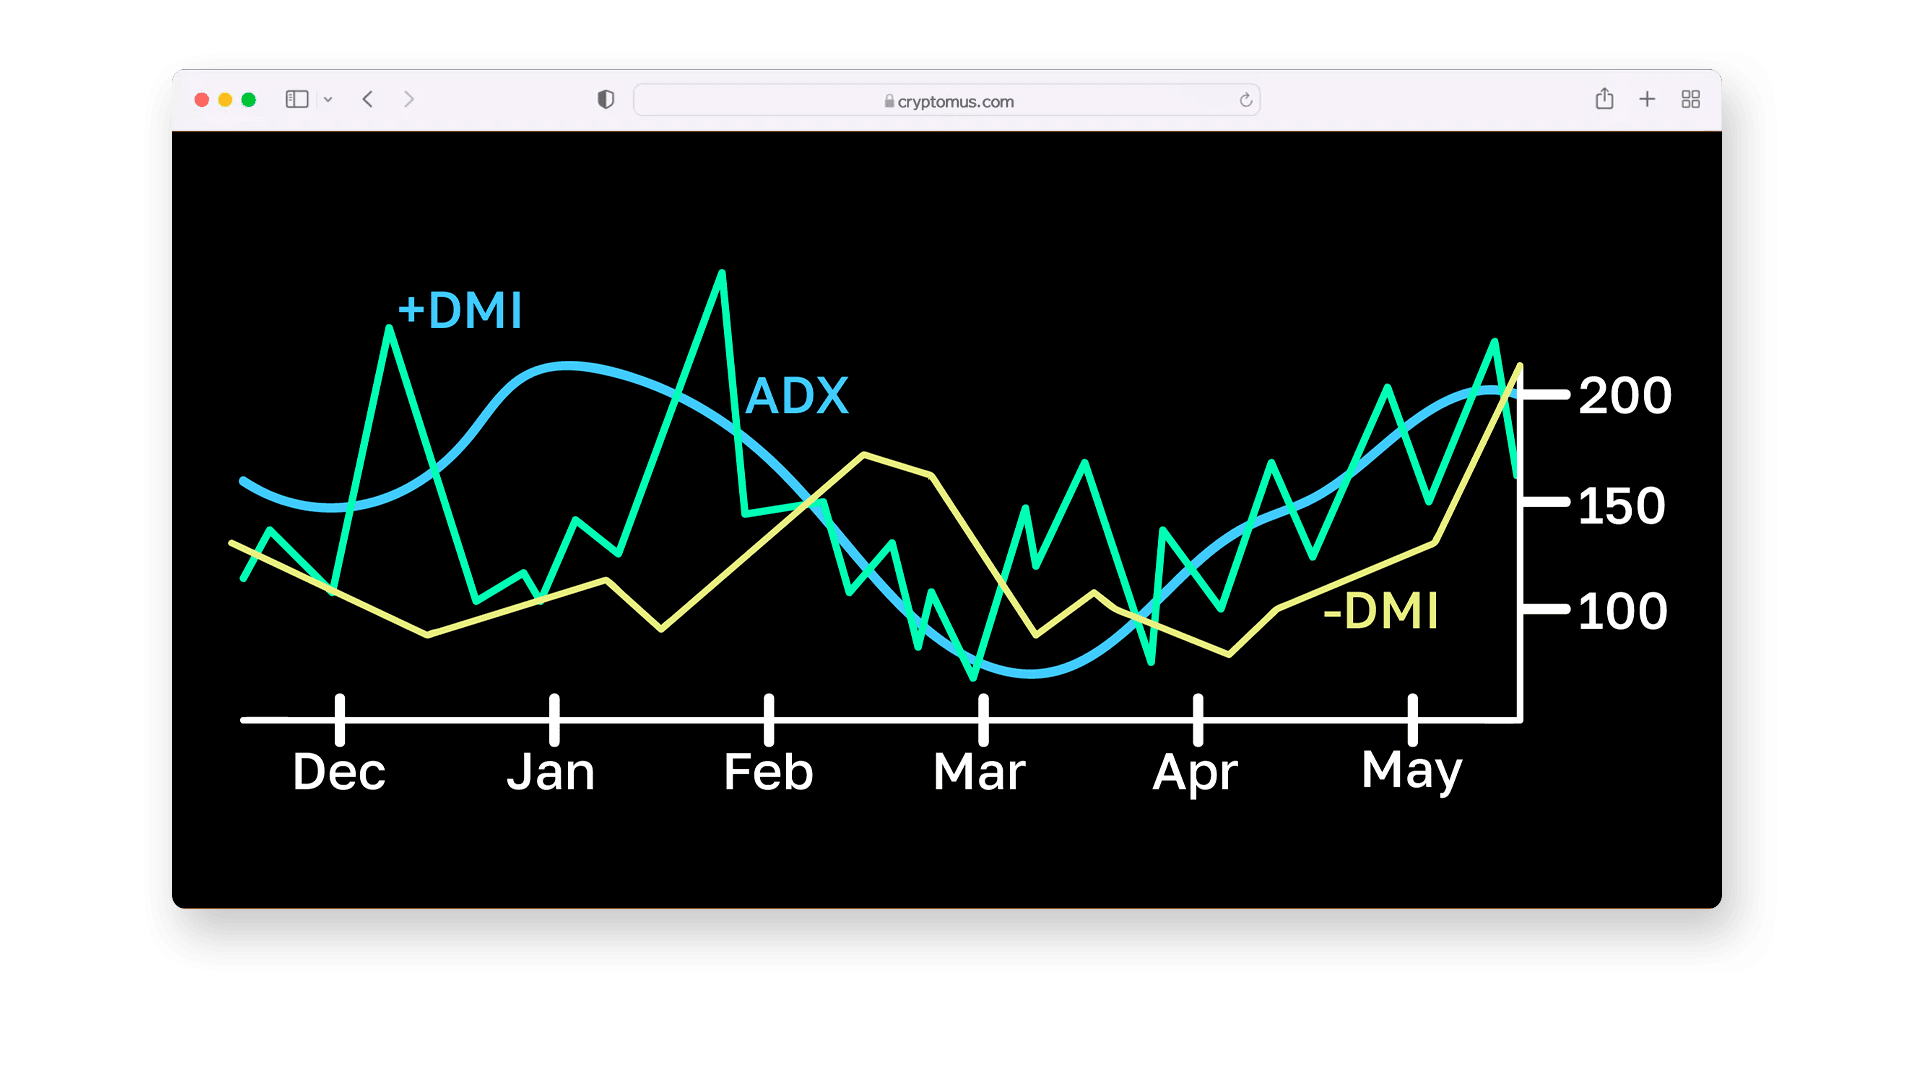 The essence of ADX is that it helps traders assess the strength of a trend. A higher ADX value (greater than 25) indicates a strong trend, while a lower value (less than 20) suggests a weak or sideways market. ADX is typically used alongside +DI (Positive Directional Indicator) and -DI (Negative Directional Indicator) to identify the strength and direction of a trend.
To calculate ADX, first calculate the difference between +DI and -DI, then smooth the value, typically using a 14-day time period. ADX itself is the smoothed value of the difference between these two indicators, helping traders determine the strength of the trend.
In summary, we explored the ten best indicators most suitable for cryptocurrency trading, each providing valuable insights into market trends, momentum, volatility, and potential entry and exit points. By effectively using these indicators, traders can enhance their decision-making processes, identify market opportunities, and manage risk.
We hope this guide helps you expand your trading toolbox.
(Army Brother Crypto) 6 years in the crypto space, short-term trading reveals the truth, and mid to long-term strategies are methodical. Accurately capturing optimal trading opportunities, real-time news empowers your investment decisions. Choose the right direction and find the right rhythm; here you have the professional perspective you need.


