#KAVABNBCHAINSUMMER $KAVA @kava
📉 Price Trend
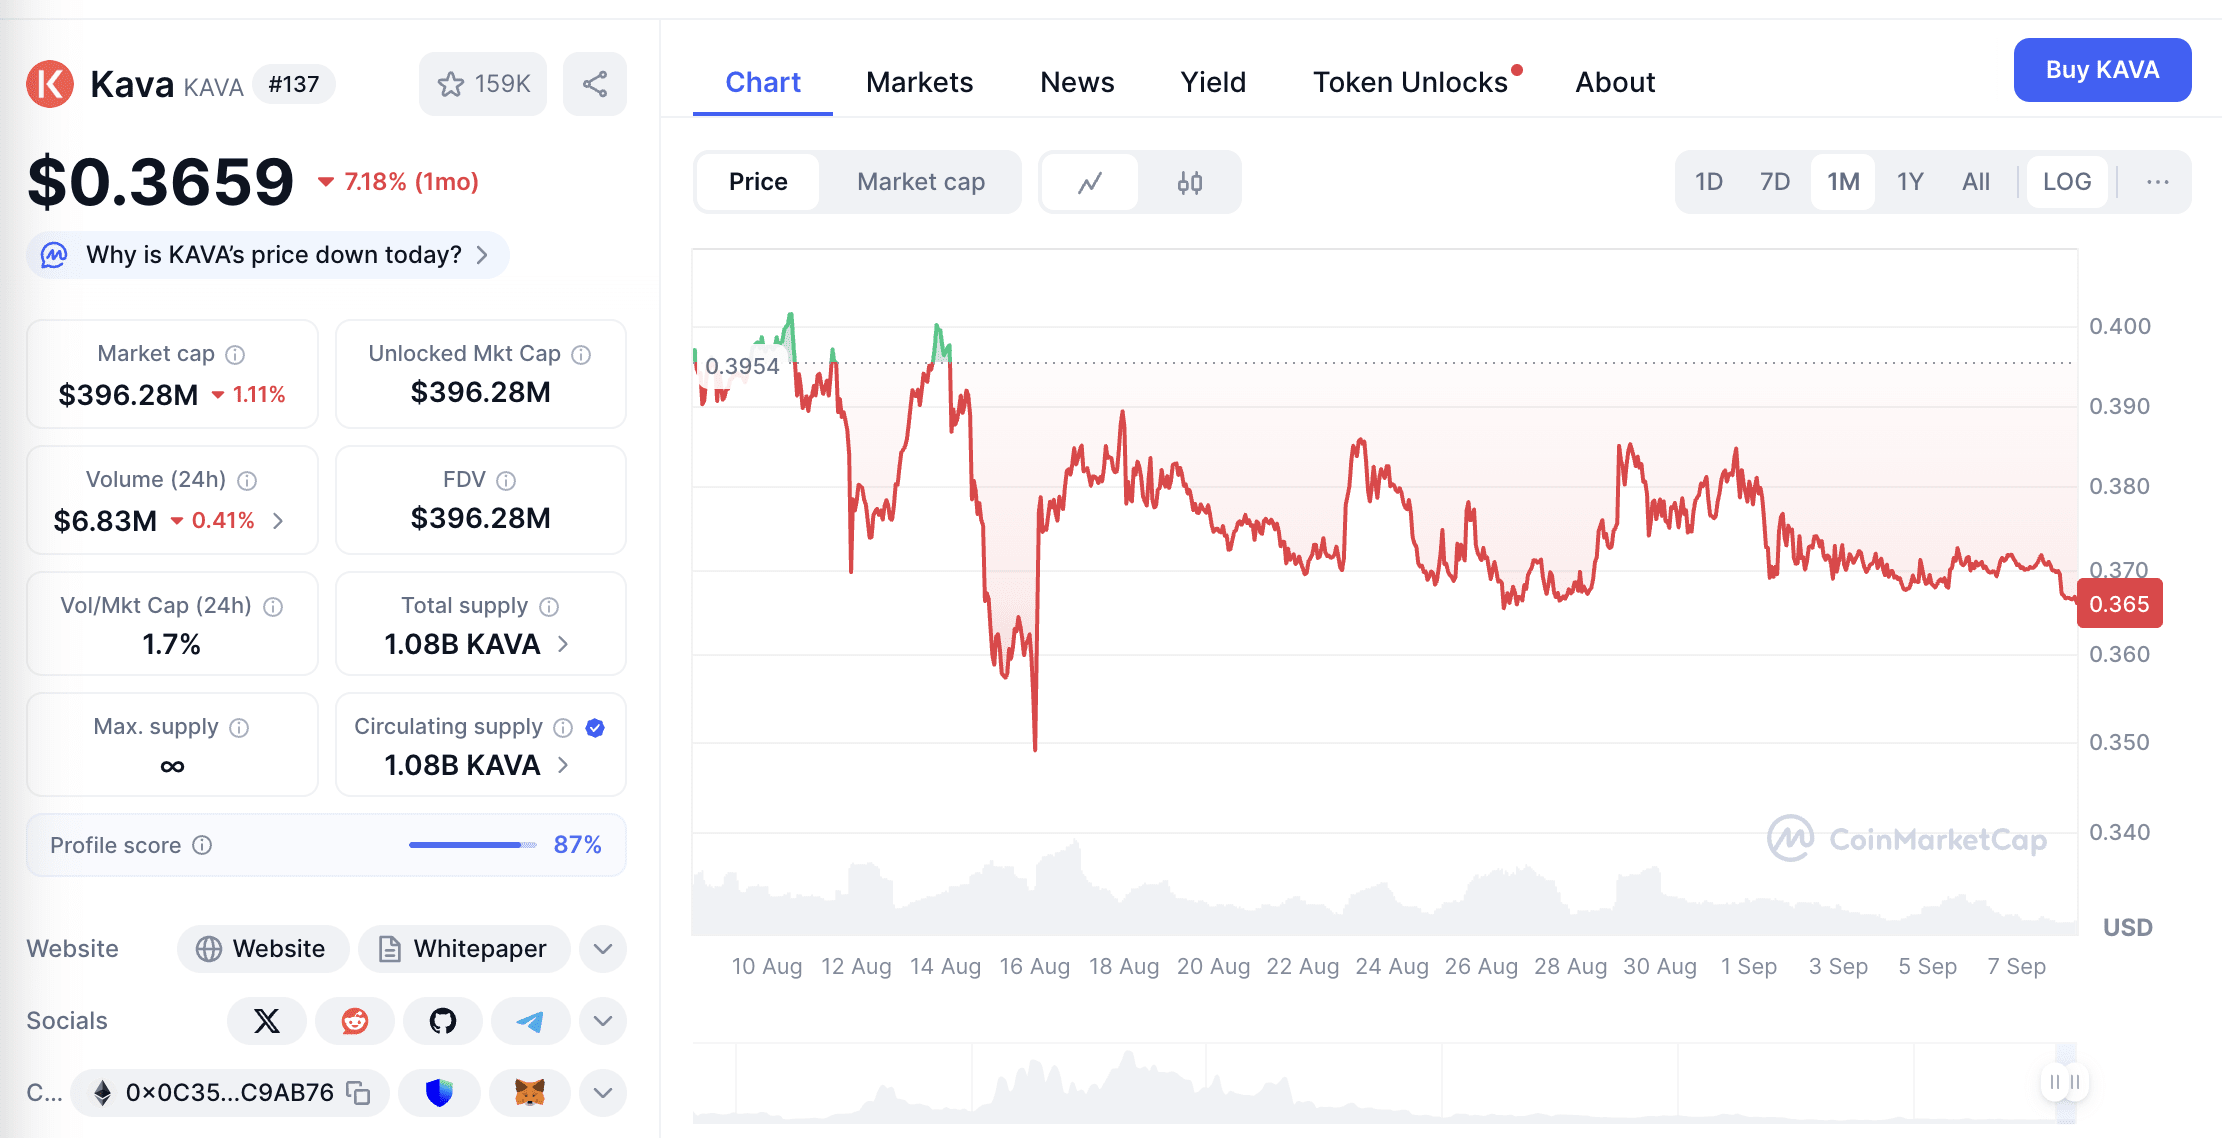
Time Frame: August 10 – September 8
Starting Price: About $0.395
Lowest Price: About $0.345 (There was a noticeable dip around August 16)
Highest Price: Close to $0.40 (Early August)
Current Price: $0.3659
Overall Change: Down about 7.18% over 1 month, trend is weak.
📊 Market Data
Market Cap: $396 million
Circulating Supply: 1.08 billion KAVA (almost equal to total supply → No significant unlocking pressure)
FDV (Fully Diluted Valuation): Also $396 million → Indicates all tokens are in circulation, risk lies on the demand side.
24H trading volume: about $6.83 million, accounting for 1.7% of the market capitalization, indicating that short-term trading activity is not very high.
📌 Trend characteristics
Fluctuating decline: The overall trend has gradually fallen from the $0.39–$0.40 range to around $0.36.
Medium-term support level: There is certain support around $0.35 (it rebounded after hitting the bottom on August 16).
Upper resistance level: The range of $0.38–$0.39, with each rebound being suppressed.
Decreased trading volume: Recent trading volume has been relatively low, indicating strong market cautious sentiment.
KAVA has shown weak performance over the past month, with a decline of about 7%, and its market capitalization remains around $400 million.
Because the total supply has almost been released, the token economics will not create new selling pressure; the key factors are still market demand and ecological applications (especially the promotion of Kava AI).
From a technical perspective, short-term support is at $0.35, with resistance at $0.38–$0.39. If it breaks through the resistance range, a rebound may occur.
KAVA has not experienced a significant reversal due to the entry of the AI track, remaining in a wait-and-see phase.
