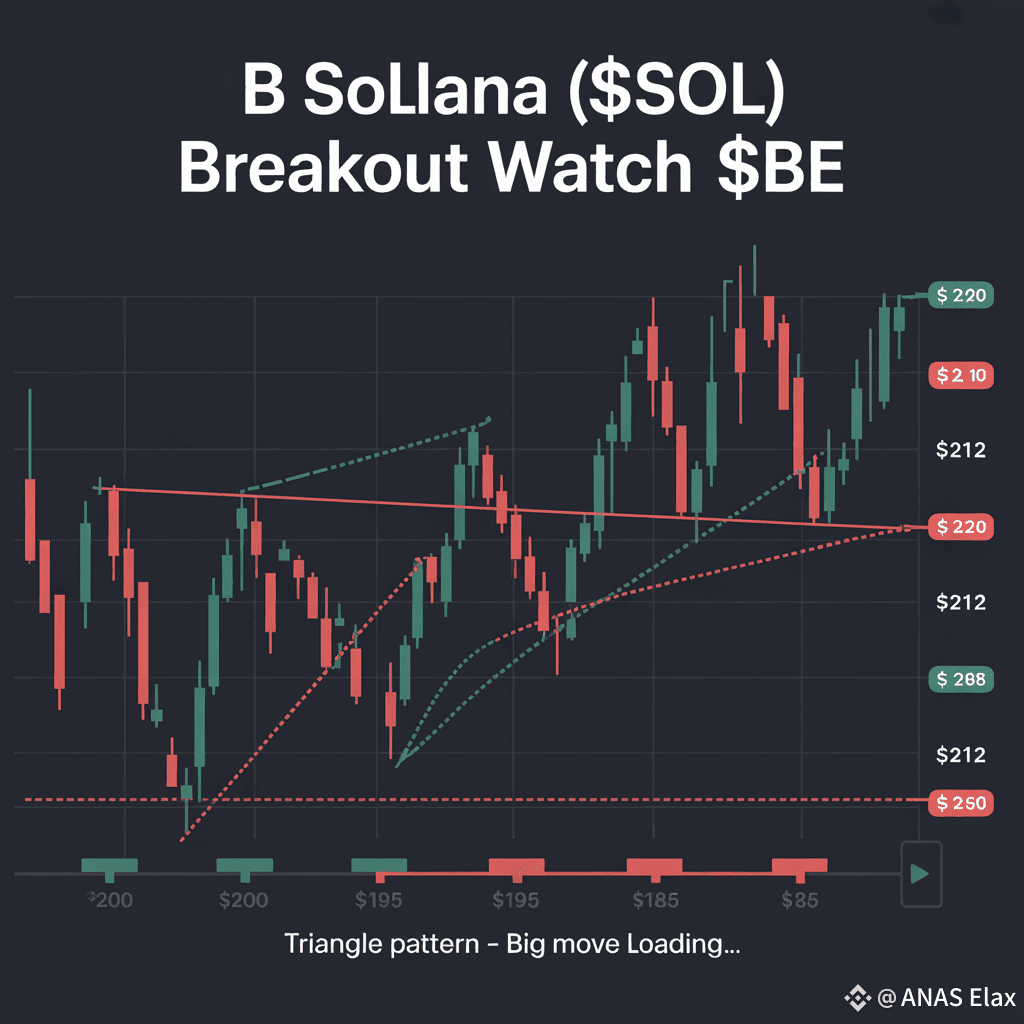
Solana is showing exciting price action right now, with the token trading around $207.4 (+3.38%). On the 1-hour chart, a symmetrical triangle pattern has formed – often a signal that a big move is just around the corner.
🔎 Why This Matters
A triangle pattern represents a battle between buyers and sellers. Once the price escapes the pattern:
Break above resistance → momentum could trigger a sharp rally. 🚀
Break below support → short-term correction may follow. 📉
📌 Key Levels to Watch
Resistance zones: $212 → $220 → $230
Support zones: $200 → $195 → $185
📊 Market Sentiment
Solana has been one of the stronger altcoins lately, drawing attention from both retail traders and large investors. If SOL can stay above $200, bulls may gain the upper hand. A decisive move above $212 could kick off the next major rally.
👉 Bottom line: SOL is at a critical stage — the breakout direction will set the tone for its next big move.
#Solana #SOL #CryptoTrading #altcoins