
Alright folks, today I was looking at the $ETH /USD chart and thought to share what future possibilities I see in it.
ETHUSD Weekly Timeframe Analysis:
So, here’s the scene: I believe ETH/USD is currently set for a decline. Why? Because after the August 11th, 2025 “Tug of War” UHV Weekly Bar, there hasn’t been any significant volume activity or price action on the weekly chart. That tug of war also happened near the upper trendline of a major bullish channel.
ETHUSD Daily Timeframe Analysis:
On the Daily timeframe (D1), ETHUSD has already made a bearish breakout of two bullish channels, which is a Structure Shift (SOW). Now, in Smart Money Concepts (SMC), a Change of Character (CHOCH) will officially occur only if ETHUSD breaks below 4060. But as per trendlines and channels, short-term traders should currently focus on bearish (shorting) opportunities as long as the 4495–4498 supply zone (resistance) holds.
Demand Zones and Important Levels
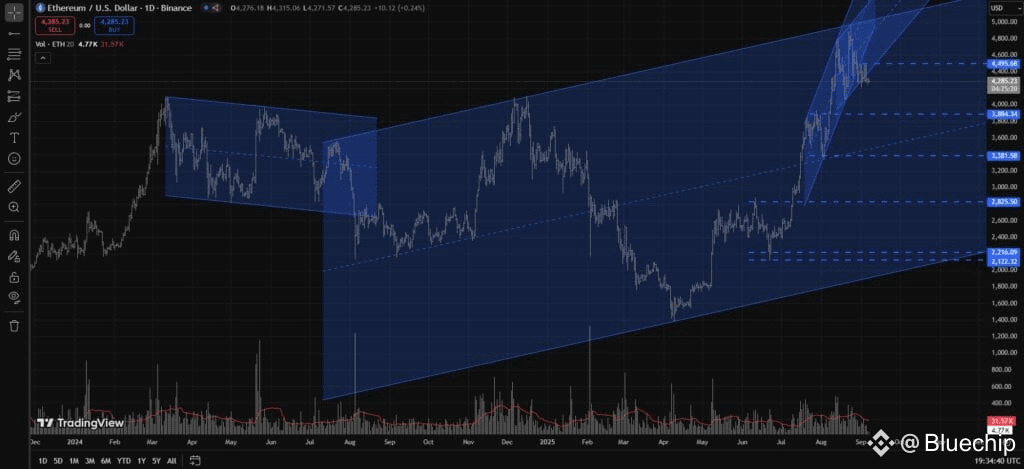
For the bears, there’s a strong demand zone (support) around 3884–3381. Why? Because this is an RBS level (Resistance turned Support)and if ETH/USD breaks below it, then on the weekly chart we’ll also get an SMC CHOCH confirmation. Inside this demand zone, the key order block lies between 3540–3381 on the daily timeframe.
If ETHUSD breaks below this demand zone as well, then the next major demand zone is at 2825–2122. Within this zone, another SMC order block exists between 2317–2122.
At the moment, I see distribution taking place in ETH/USD. On the daily timeframe, after the September 5th, 2025 Daily Down Closing, I think the markdown phase has already started. Full confirmation of this markdown will happen after a bearish breakout below 4060, but the SOW is already clearly visible.
Now, if I were in your place looking to buy ETH/USD, I would not consider buying at current levels. However:
If price drops into the 3884–3381 zone, then I would consider some buying.
If ETHUSD drops even further into the 2825–2122 zone, then I would consider heavy buying.
So, these are my ETH/USD insights as of September 8th, 2025. After this date, the possibilities I’ve highlighted may play out. Of course, ETHUSD can completely ignore my analysis and jump straight from current levels to break 5200—but in my view, that is highly unlikely at this moment.
Also check my XAUUSD Weekly Analysis for September 8 to September 12, 2025 here.
TLDR:
ETH/USD is showing weakness after a major tug of war near the top of its bullish channel. On the daily chart, it has already made a bearish structure shift. Key demand zones to watch are 3884–3381 and 2825–2122. Until then, short-term traders may focus on bearish setups unless ETH/USD reclaims above the 4495–4498 supply zone. Markdown phase looks to have started, but full confirmation comes only after a 4064 breakdown.
Always DYOR and size accordingly. NFA!
📌 Follow @Bluechip for unfiltered crypto intelligence, feel free to bookmark & share.
#BTCvsETH #MarketPullback #BinanceHODLerOPEN #USNonFarmPayrollReport #RedSeptember


