---
🚨 GALA/USDT – Trader’s Eye View (4H Chart Analysis) 🚨
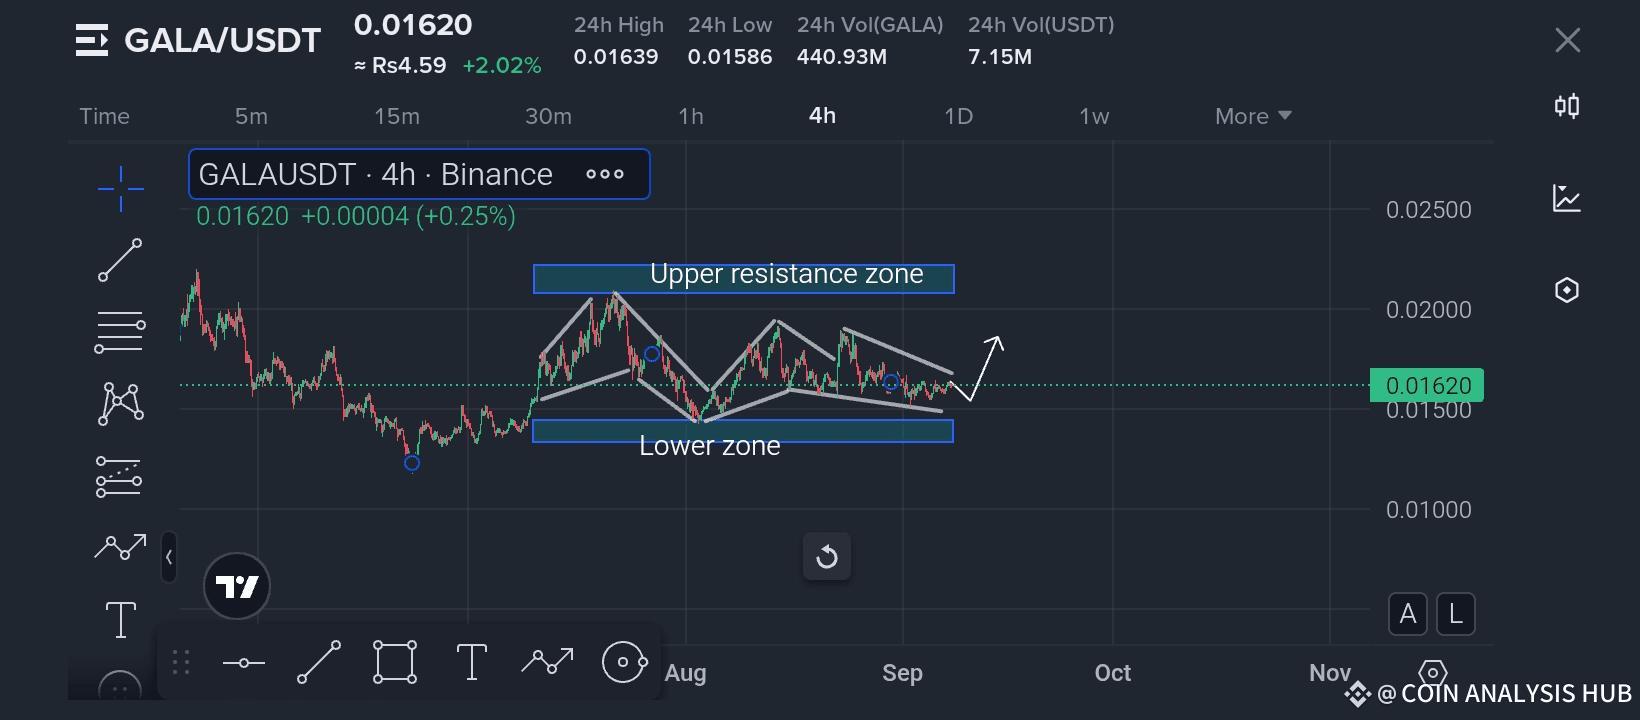
Right now, GALA is trading around 0.01620 USDT after showing some sideways consolidation. Looking at the 4-hour chart, we can clearly see that the price has been moving between two major areas:
🔹 Upper Resistance Zone – around 0.02000–0.02500 USDT
🔹 Lower Zone / Support – around 0.01500 USDT
The market has formed a clear falling wedge pattern, which usually hints at a possible breakout to the upside. Notice how price has been respecting the lower zone support while rejecting from resistance. This shows buyers are still active and defending these levels.
📊 Current Scenario:
Price is holding above the lower zone, showing accumulation.
A breakout from the wedge can push GALA towards the upper resistance zone again.
Short-term traders can watch closely for confirmation candles before entering.
⚠️ Key Levels to Watch:
Support: 0.01500
Resistance: 0.02000–0.02500
If bulls step in strongly, we may see a rally towards resistance. However, if price breaks below 0.01500, then sellers might take control.
💡 Trader’s Tip: Always manage risk wisely—set your stop loss below strong support levels and avoid emotional trading.
---
✨ If you find this analysis useful, don’t forget to LIKE ❤️, SHARE 🔄, and FOLLOW ✅ my channel. Your support helps me reach more traders and motivates me to keep sharing these updates. Let’s grow together and stay ahead of the market! 🚀
#ListedCompaniesAltcoinTreasury
Best of luck 🤞 🍀 🤞

