Are we helpless when we encounter fluctuations? Earning money by luck in trending markets can lead to losses by skill in fluctuating markets. I hope this article provides everyone with some observational insights!!!
Technical indicators are tools for observing market conditions. By using certain indicators to confirm each other, we can effectively filter out fluctuations and confirm trading opportunities.
For example, I previously mentioned a trading method that only uses the 20 moving average. When the 20 moving average is trending upwards, only take long positions when the price crosses above the 20 moving average; when the 20 moving average is trending downwards, only take short positions when the price crosses below the 20 moving average.
Although simple and intuitive, it is still subject to criticism, as the moving average system is prone to repeated stop-losses in fluctuating markets.
In fact, as long as you verify from multiple dimensions, you can effectively avoid fluctuations. Here, we combine the MACD indicator to filter out fluctuations and false opportunities in trading based on the 20 moving average.
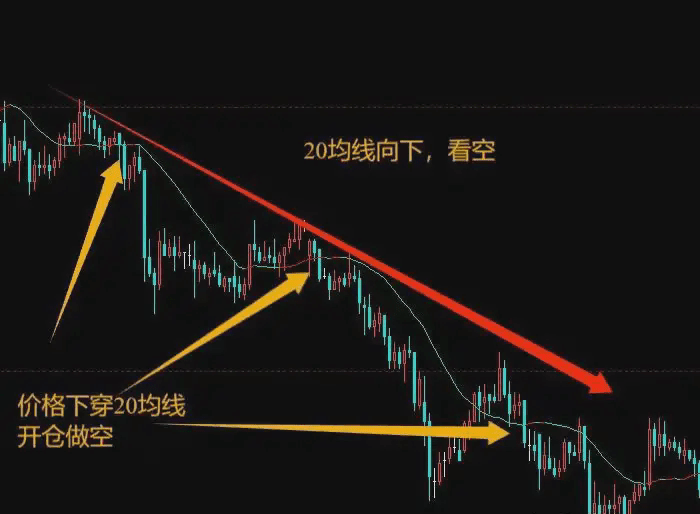
In the above chart, following the original method, here the 20 moving average is downward, and the price breaks below the 20 moving average, so a short position is taken. In hindsight, it is clear.
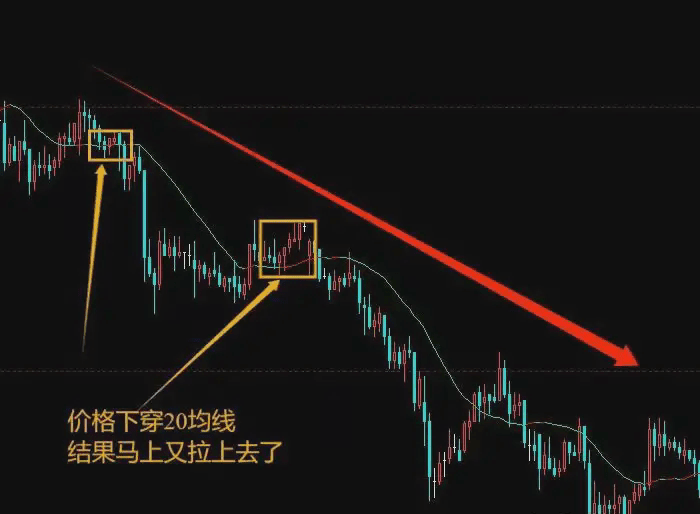
However, at that time, after the price crossed below the moving average, it immediately crossed back again. As shown in the above chart, this crossing at that time was a false move.
Then, we can refer to MACD, which can be relatively easy to identify. Learning these three MACD patterns can save you 5 years of wandering in trading. I have already mentioned the use of MACD in previous articles; those who haven't seen it can follow me, and later check my homepage for other articles to catch up on the homework.
Regarding MACD, when bullish, only take opportunities for dual lines crossing above the zero axis and golden crosses above the zero axis; when bearish, only take opportunities for dual lines crossing below the zero axis and death crosses below the zero axis.
Based on this rule, let's combine it with MACD and revisit the earlier chart. In the above chart, these few downward crosses of the 20 moving average are false moves, conflicting with the MACD pattern.
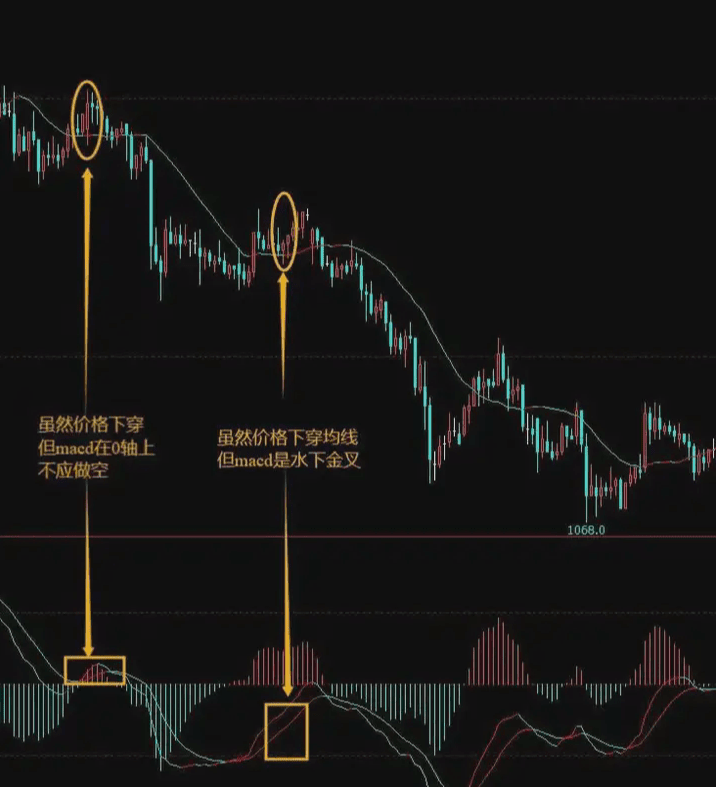
The first price breaks below the 20 moving average, but the corresponding MACD dual lines are actually above the zero axis, so the MACD at this time is not a bearish pattern. The downward break of the 20 moving average here is very likely a false move, and subsequent trends also prove that the fluctuation continues.
Looking at the second price breaking below the 20 moving average, it is actually a golden cross below the MACD zero axis, and when the red bars are expanding, it is also not a bearish pattern. This means that there is no resonance formed, and it should be abandoned. If a short position is taken here, the subsequent trend will knock out the stop-loss at the previous high point.
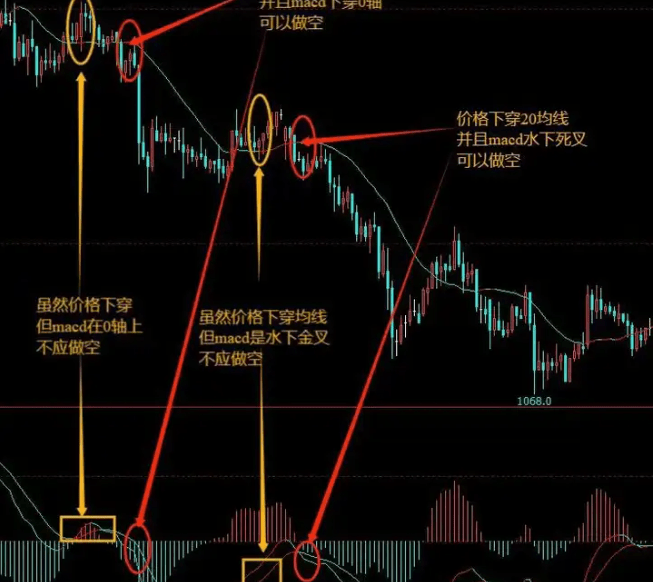
Subsequently, after experiencing several K-line fluctuations, the price once again broke below the 20 moving average. As shown in the above chart, the opening position indicated by the red arrow corresponds to the MACD, one is when the dual lines break below the zero axis, and the other is a death cross below the zero axis; both are bearish patterns.
The price breaking below the 30 moving average and the formation of a bearish MACD pattern has created a resonance, resulting in a higher accuracy for opening positions.
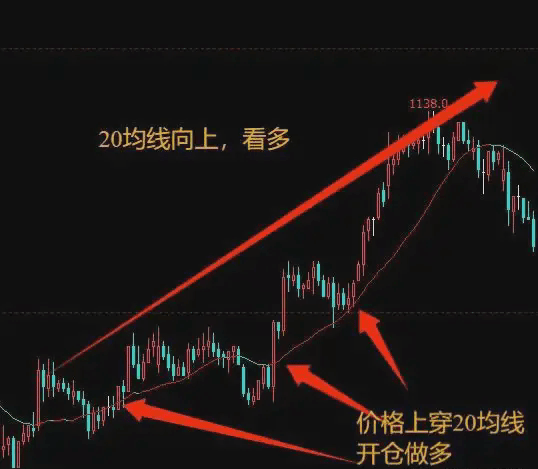
Let's look at another long position. In the above chart, when the 20 moving average is upward, look for long positions only when the price crosses above the moving average.
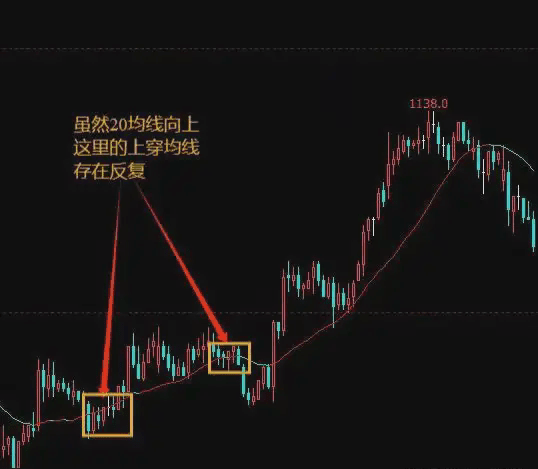
In hindsight, it is incredibly clear. However, at the time, encountering prices repeatedly crossing above and below the moving average was quite frustrating.
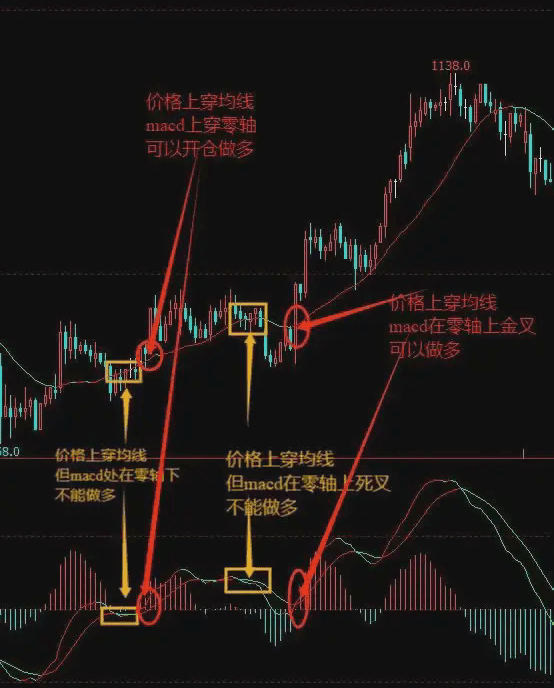
Introduce MACD to filter. In the above chart, as indicated by the yellow box: although the price crosses above the 20 moving average, the corresponding MACD is either below the zero axis or has a death cross above the zero axis, conflicting with the bullish state of the moving average, so a position should not be opened.
As time goes by, when it reaches the area marked by the red circle, when the price crosses above the 20 moving average, the MACD is either crossing above the zero axis or has a golden cross above the zero axis, forming a resonance between the moving average and MACD's bullish pattern.
At this point, going long would greatly increase the success rate, and the subsequent price changes also confirm this.
Do you feel it? If it's still a bit vague, I suggest you watch it a few more times.
Understanding the relationship between the two technical indicators and using them in combination is really efficient and practical. I hope it is useful to you!
(Brother Jun's Crypto) 6 years of deep cultivation in the crypto space, short-term trading reveals the true essence, and mid to long-term layout is methodical. Precisely capturing optimal trading opportunities, firsthand news empowers your investment decisions. Choose the right direction, find the right rhythm, here is the professional perspective you need.$BNB
