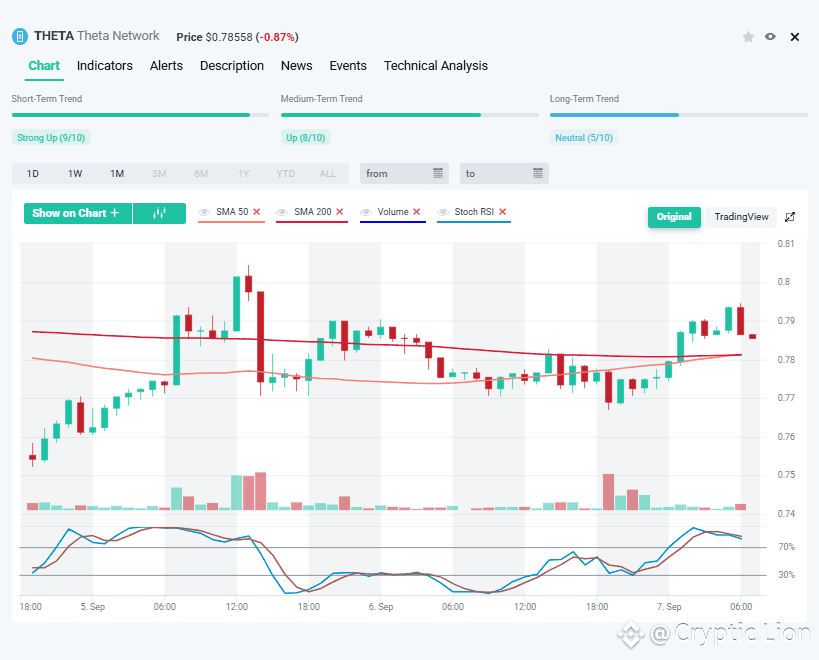
The 1-hour chart for Theta Network (THETA) currently shows its price hovering around $0.7855, with a slight decline of -0.87% in the most recent session. Despite this small dip, the overall structure reveals that the asset is sustaining bullish momentum in the short and medium term, while the long-term outlook remains neutral.
Short- and Medium-Term Momentum
The short-term trend is rated strong up (9/10), and the medium-term trend also signals strength with an up rating (8/10). This reflects that THETA has been gaining traction over the last few sessions, supported by multiple bullish candles. The movement above the short-term averages is evidence of active buying pressure, particularly as the price has managed to reclaim the $0.78–0.80 zone multiple times after small pullbacks.
The candlesticks show higher lows and higher highs, reinforcing short-term bullishness. However, intraday volatility remains visible, as indicated by the long wicks on both green and red candles—suggesting both bulls and bears are actively testing momentum.
SMA Dynamics
The chart displays the 50-day SMA (Simple Moving Average) and the 200-day SMA. At present, the price is hovering around these moving averages, which are relatively flat. This indicates a market in transition—short- and medium-term trends are improving, but the longer-term structure is still uncertain. A sustained break above the 200-day SMA with volume support would strengthen the case for a medium-to-long-term bullish reversal.
Stochastic RSI and Market Strength
The Stochastic RSI shows that the momentum recently entered overbought territory but is beginning to turn downward. This implies that while buyers have been dominant, the market could face short-term consolidation or a mild correction before the next leg higher. Traders should watch for a potential pullback toward the \$0.77 support zone, where the SMA levels converge, as this area may act as a retest before resuming upward movement.
Volume Patterns
Volume analysis reveals sporadic spikes accompanying bullish candles, but the consistency of volume support is not yet strong enough to validate a decisive breakout. Sustained higher volume alongside bullish candles would be the confirmation signal traders look for before calling a full reversal trend.
Outlook and Strategy
Bullish Case: If THETA can hold above $0.78 and break past $0.80 with volume, it may target the next resistance levels around $0.82–0.85.
Bearish Case: A failure to maintain above the SMA cluster could trigger a drop back toward $0.75, which is the immediate support zone.
In summary, Theta Network currently shows strength in the short and medium terms, supported by strong upward momentum indicators, but the long-term picture remains neutral. Traders should monitor the $0.78–0.80 zone closely for either a breakout confirmation or a consolidation phase.
👉👉 Trade here $THETA #MarketPullback