Intro: The Jungle in September
Hook with the myth: “Traders call September the cursed month for crypto.”
Short punch: History shows red, but the jungle always has hidden paths.
1. The History of Red September
Quick stats (example):
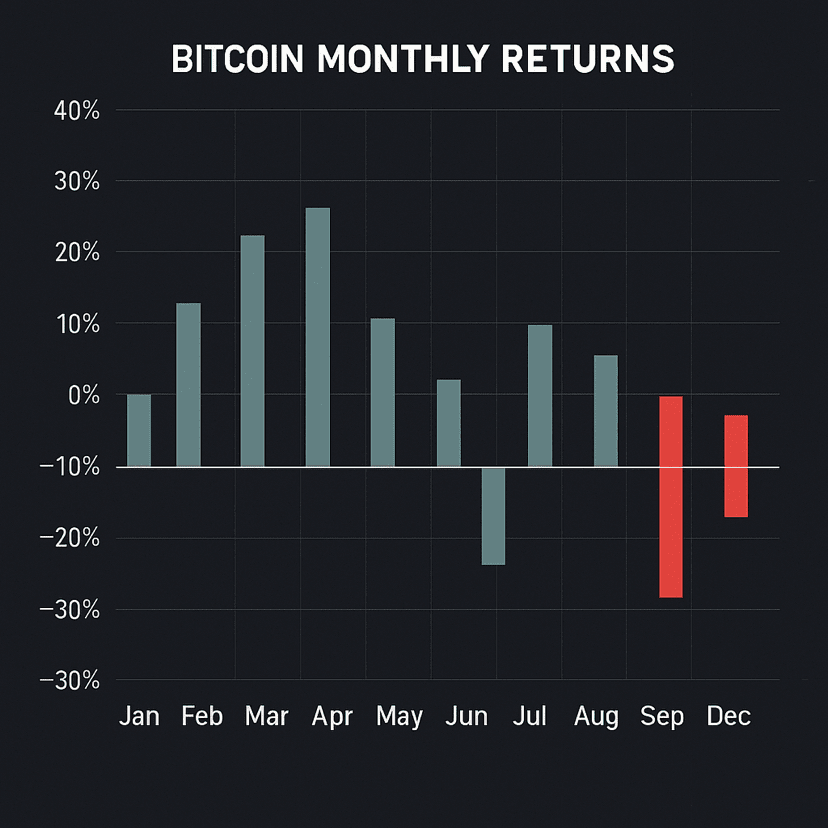
Since 2013, Bitcoin has averaged –3% to –5% in September.
Only 2023 & 2024 broke the streak.
Chart/graphic idea: BTC monthly returns, highlight Sept.
2. Why September Tends to Be Red
Institutional rebalancing (funds take profit before Q4).
Lower liquidity after summer.
Traders front-running each other = panic spirals.

3. 2025 Context: Same Old Trap?
Bitcoin at $123K ATH → pullbacks are normal.
SOL, ETH, BNB following BTC’s lead.
Fear headlines (tariffs, rate cuts, SEC chatter) feeding the “red” story.

4. The Jungle View: Lessons From the Past
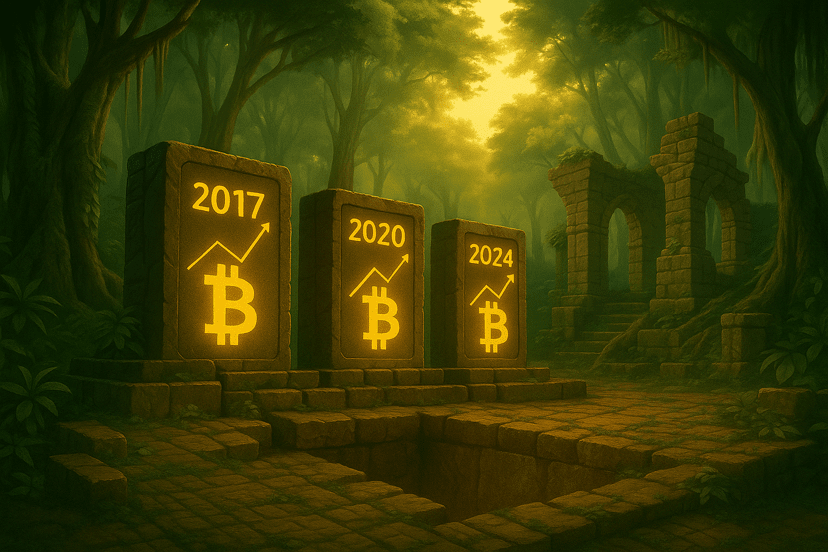
Every Red September was followed by a strong Q4.
Smart hands accumulate while weak hands panic.
Example: 2020 September dip → November ATH run.
5. Strategy: How to Survive the Red
SOL (trend-line support) → Keep this as your technical anchor.
BTC (macro leader) → Highlight that BTC dominance often dictates when the red ends; use BTC levels to time broader entries.
ETH (liquidity gauge) → Mention ETH’s role as a liquidity magnet — if ETH holds key zones, alts usually survive the red.
BNB (exchange barometer) → Add how BNB can signal sentiment since it’s tied to exchange volume and activity.

Conclusion: The Jungle Wisdom
🌴 “Even the bloodiest Septembers never stopped the sunrise of October. The jungle rewards patience, not panic.”
CTA: Are you fearing Red September or preparing for Green October? Drop your thoughts below.

#RedSeptember #CryptoMarketMoves #bitcoin #altcoins #JungleWisdom @CryptoTyrone