
Do you really understand support and resistance?
Below I will introduce:
A. What are support lines and resistance lines;
B. 4 key points you must know when using support and resistance lines;
C. Trading strategies for entering and exiting using support and resistance lines.
And finally:
Share some tips and details on how to draw support and resistance lines.
And the steps in real trading
OK,
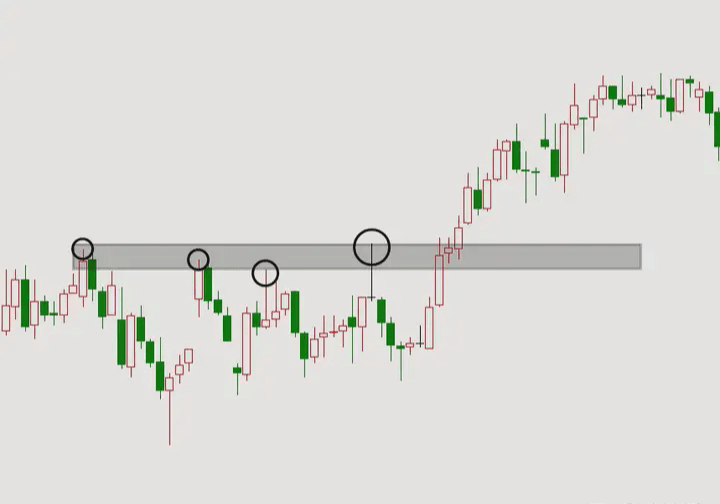
A1. What is a resistance line?
A resistance line forms when the price fails to break through a certain level multiple times, and the points that connect create a resistance line. When drawing a resistance line, at least two or more points must be connected to be considered an effective resistance.
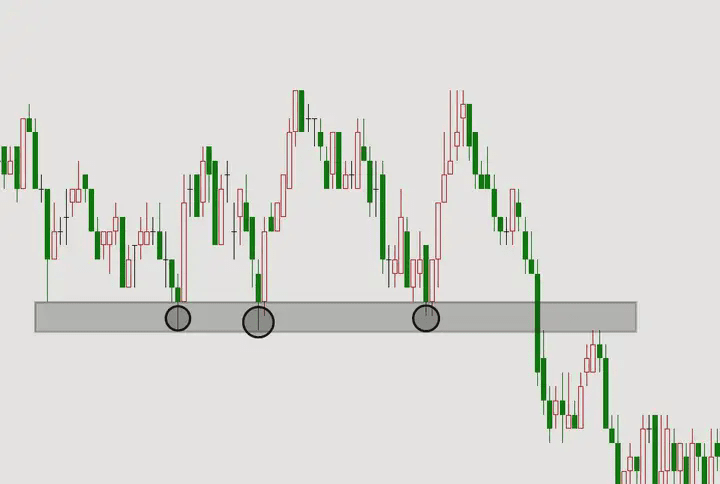
A2. What is a support line?
The support line is formed when the price repeatedly fails to break below a certain price level; that position then becomes the support level. A few positions connected together form the support line. When drawing a support line, at least connect two or more points to qualify as an effective support.
Next, I will introduce four points of knowledge about support and resistance.
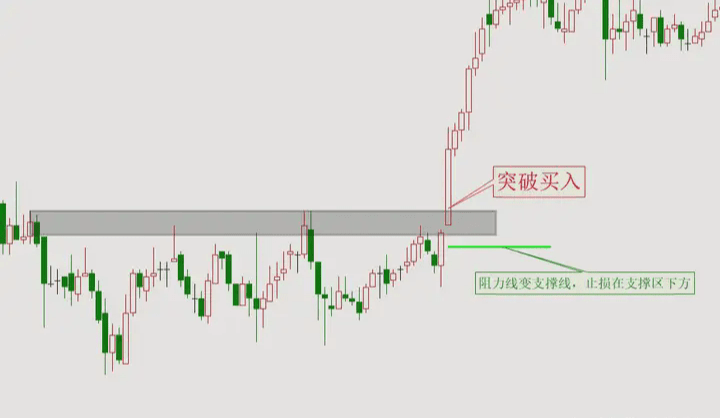
B1. The transformation and application of support and resistance lines:
When the price breaks through a resistance line, the resistance line will turn into a support line. When the price returns to that position next time, it will form support, holding up the underlying price. Conversely, when the price breaks below a support line, the support line will turn into a resistance line. When it returns to that price level again, it will form effective resistance.
Support and resistance interchange
B2. The strength and effectiveness of support and resistance:
The more points a support and resistance line connects, the greater its strength and effectiveness. A resistance line connecting four points will be more effective than one connecting two points.
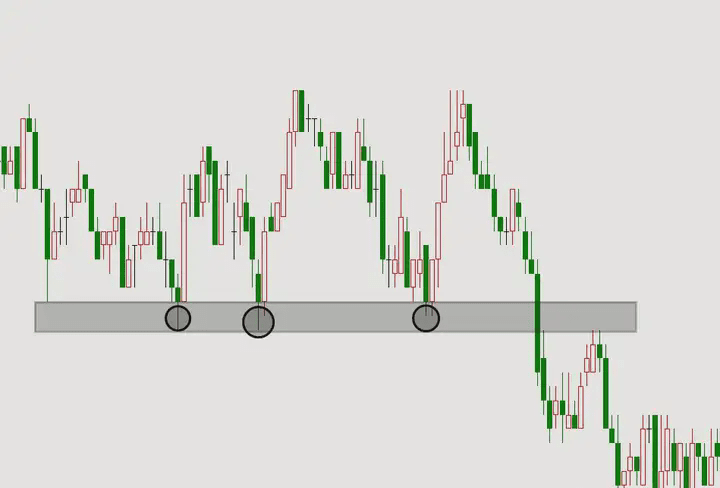
B3. Lines are not lines but areas:
Support and resistance are not just a single line; they should be treated as an area. Therefore, when the stock price reaches the support or resistance area, there will be a rebound.
When you visualize it, do you feel confused, thinking there are too many support and resistance lines, making it difficult to distinguish which one to use?
So it is essential to know--
B4. Different time frames of support and resistance:
Drawing support and resistance in higher time frames is clearer and simpler. Moreover, the strength and validity of support and resistance in higher time frames are much greater than those in lower time frames.
Thus, when drawing support and resistance in a higher time frame, highlighting important support and resistance points, we will no longer draw dozens of support and resistance lines.
Next, I will introduce two strategies for entering the market using support and resistance, as well as one strategy for stop loss.
C1. Firstly, the strategies for entering the market are breakout entry and pullback entry, along with their advantages and disadvantages.
Breakout entry occurs when the price breaks through a resistance line; it can be seen as breaking through a significant barrier, and the outlook turns bullish. You can enter the market directly, with the advantage of capturing a significant profit wave later, but the disadvantage is that if there is a false breakout, you will end up buying at the ceiling and getting trapped above (What is a false breakout? An article about false breakouts will be written later).
Entering on a pullback is when after breaking resistance, you wait for the price to pull back to the original resistance area before entering the market. The advantage is that it is relatively stable and safe, while the disadvantage is that if the price does not pull back but rises directly, you will miss out on a significant increase and miss the opportunity.
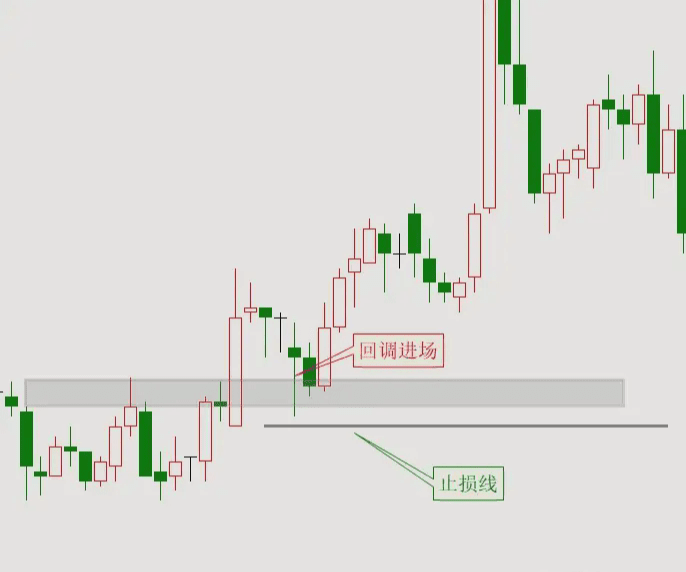
C2. The strategy for stop loss is to use the support line as an anchor point, setting the stop loss below the support level. The price must challenge the support level before reaching your stop loss point; only if the challenge is successful will it touch your stop loss.
Next, I will share some tips and details on how to draw support and resistance lines:
Should the bottom line be drawn on the candle body or the shadow?
No, it is to draw an area: the correct approach is to draw a line under the premise of touching the most points, then draw an extreme value line, and then form a support or resistance area (the gray area in the upper figures).
First, go to the higher time frame chart to draw support and resistance, for example, for swing trading, the higher time frame is the 1H chart, while the 5M chart serves as the trading time frame.
I usually only draw the most recent support and resistance levels, which saves a lot of time. The method is to first draw lines, and then turn them into an area. After finishing the 1H chart, switch to the 5M time frame to draw the most recent support and resistance, making it clearer.
Finally, a demonstration of a complete trading plan using support and resistance lines.
Demonstration:
Plan for tomorrow (July 23): to trade pulp. Currently in a market closure state, preparing for tomorrow's plan--
1. Open the 1H chart and draw the most recent support and resistance zones: 1H support zone 5626-5635, 1H resistance zone 5764-5777.
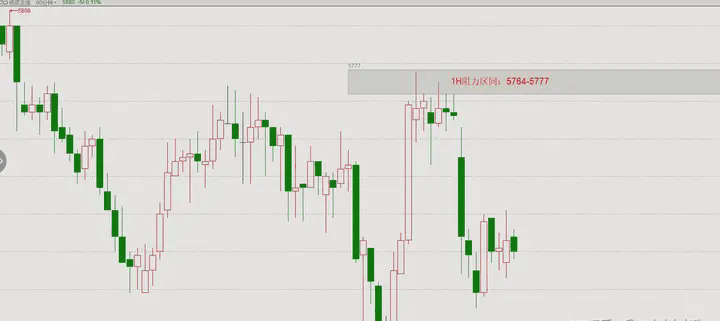
1H support zone 5626-5635, 1H resistance zone 5764-5777.
2. Open the 5M chart and draw the most recent support and resistance zones: 5M support zone 5666-5676, 5M resistance zone 5698-5702.
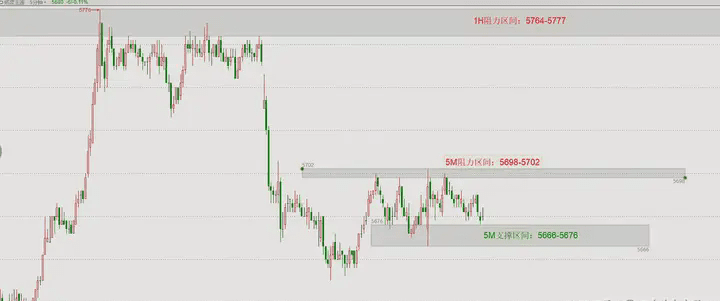
5M support zone 5666-5676, 5M resistance zone 5698-5702.
3. Using breakouts to enter the market:
Plan A: After the market opens, on the 5M chart, break through the extreme value of the 5M resistance zone at 5702, enter the market to go long at market price, stop loss at 5694; take profit at 5764 (the low point of the 1H resistance zone).
Plan B: After the market opens, on the 5M chart, break through the extreme value of the 5M support zone at 5666, enter the market to go short at market price, stop loss at 5680; take profit at 5636 (the high point of the 1H support zone).
4. Position: Determine the position size based on a total stop loss of 2% of the capital.
Summary:
Support and resistance are essential skills in technical analysis, but we cannot rely solely on support and resistance as the only buying points; they must be combined with other technical tools and analyses.
(Military Brother's secret) 6 years of deep cultivation in the cryptocurrency circle, short-term speculation reveals the truth, and mid-long term layout has rules. Precisely capture the optimal trading opportunities, one hand of news empowers your investment decisions. Choose the right direction, find the right rhythm, here is the professional perspective you need.


