Many people think trading is only for experts… but that’s not true ❌.
With 5-minute charts, even beginners can catch small moves and aim for $40/day with quick trades 🚀.
🕒 What is a 5-Minute Candlestick Chart?
Each candle shows 5 minutes of price movement:
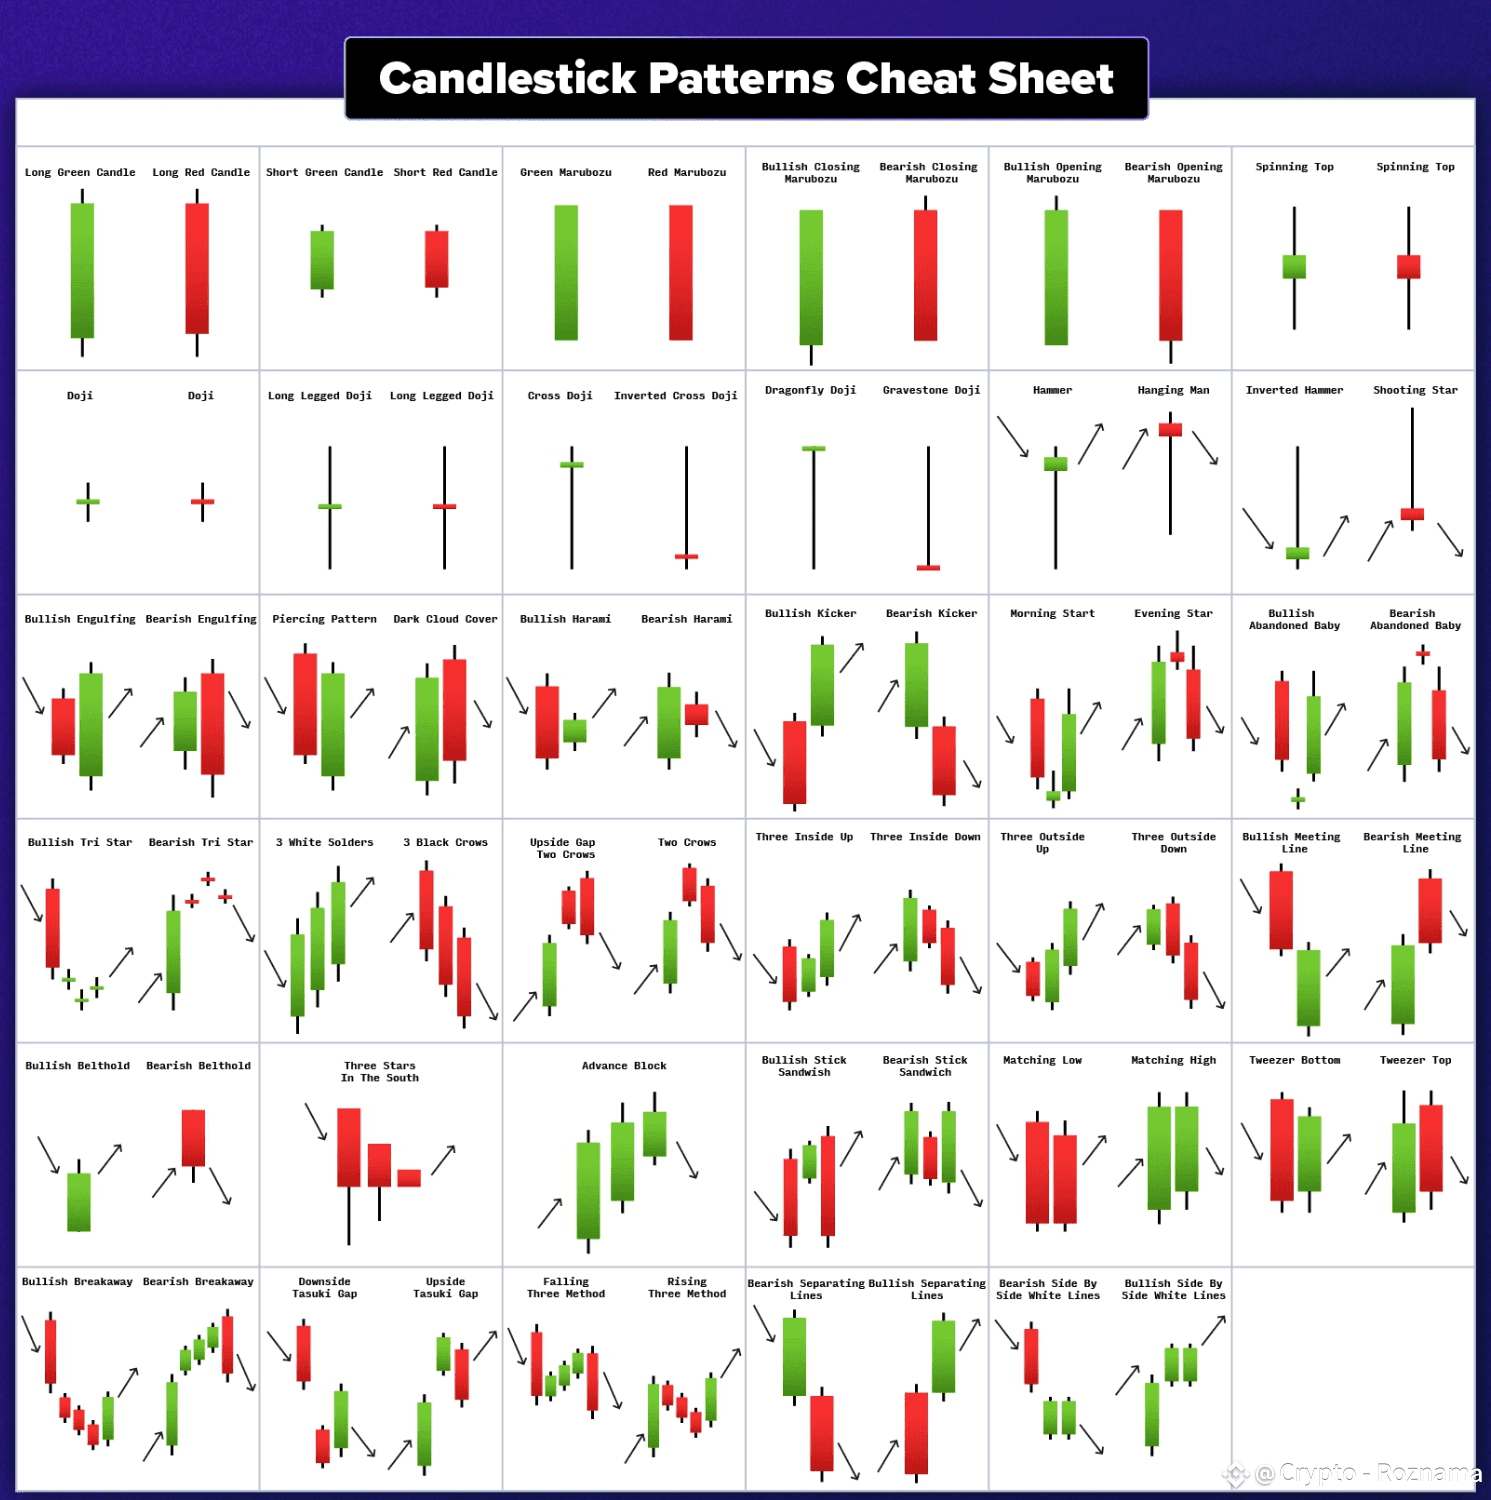
🟢 Green Candle = Price went UP
🔴 Red Candle = Price went DOWN
By reading these candles, you can spot simple patterns 🎯.
📊 3 Easy Candle Patterns for Beginners
1️⃣ Doji ➕ → The “Confused Candle”
✨ Looks like a plus sign
✨ Means buyers & sellers are equal
✨ Often shows a trend might reverse
2️⃣ Engulfing 🔥 → The “Takeover Candle”
🟢 Bullish Engulfing → Small red ➡ Big green → Price may go UP
🔴 Bearish Engulfing → Small green ➡ Big red → Price may go DOWN
3️⃣ Hammer 🔨 → The “Bounce Candle”
✨ Small body on top + long lower tail
✨ Shows sellers tried to push down but buyers pushed back
✨ Can signal price going up
🛠️ How to Trade Them
✅ Step 1: Pick a stock or crypto pair
✅ Step 2: Watch charts in active hours (Morning/Afternoon)
✅ Step 3: Spot a clear pattern (Ex: Bullish Engulfing)
✅ Step 4: Enter trade → Buy if going up, Sell if going down
✅ Step 5: Exit early → Lock small profits 💵
💰 Example Trades
🟢 Bullish Engulfing → Buy → Price rises → Sell → +$10
🔴 Bearish Engulfing → Sell → Price drops → Buy back → +$8
👉 Do this 4–5 times = $40/day 🎉
🏆 Why Beginners Love This
⚡ Simple & clear patterns
⚡ Quick trades = Fast results
⚡ Low risk, small wins add up
📌 Pro Tips
✔ Start small, don’t risk too much
✔ Practice daily → Experience builds skill
✔ Candles tell the market’s story 📖
🚀 With 5-minute charts, you can grow confidence + steady profits step by step 📈✨
#MarketPullback #Beginnersguide #RedSeptember