🚨 Trader’s Eye on SOL/USDT (4H Chart) – Technical Analysis Update 🚨
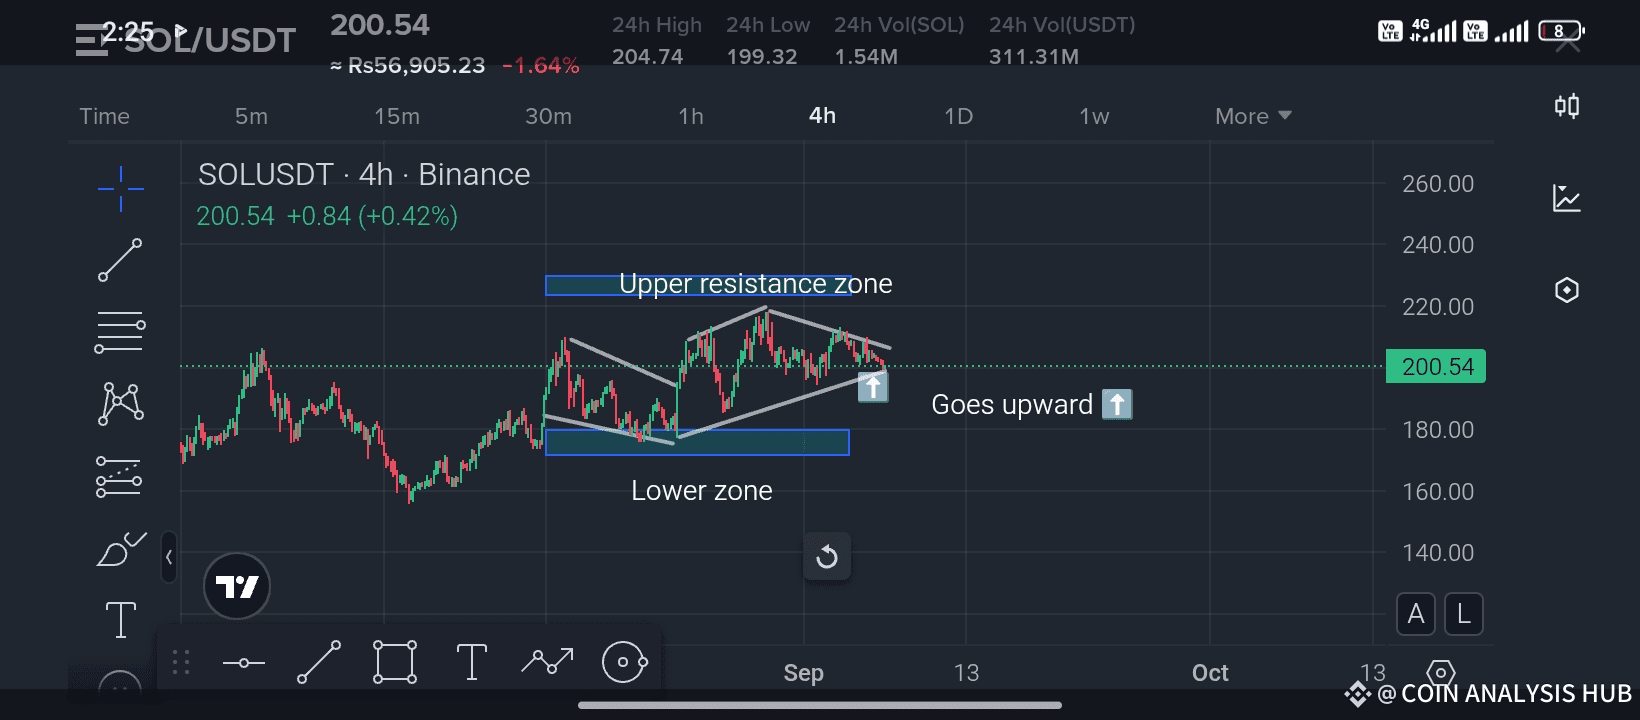
Currently, SOL is trading around $200.54, showing a slight gain of +0.42% on the 4H timeframe. The chart structure is very interesting and worth a closer look:
📊 Chart Breakdown:
🔹 Lower Zone Support: SOL has repeatedly bounced from the $180–185 area, confirming it as a strong demand zone. Buyers are stepping in every time price dips here, giving strength to the bulls.
🔹 Upper Resistance Zone: Around the $210–215 level, we can clearly see supply pressure. Price has tested this zone multiple times but hasn’t been able to close above with strength yet. A breakout here could trigger a strong upside rally.
🔹 Current Structure: SOL is moving inside a symmetrical channel. After consolidating near the lower range, it is now showing signs of pushing upward. If momentum builds, we could see a breakout attempt toward the upper resistance zone.
📈 Bullish Outlook:
If SOL sustains above the $200 psychological level, the chances of testing $210–215 increase.
A clean breakout and close above $215 could open the path toward $230–240 levels in the short to mid-term.
⚠️ Bearish Scenario to Watch:
Failure to hold above $200 could drag the price back to the $185–190 support zone. Losing this zone might extend correction toward $170.
💡 Trader’s Tip: Always wait for confirmation candles before entering after a breakout. Many traders get trapped in false breakouts; patience is key.
🔥 If you found this analysis useful, don’t forget to LIKE 👍, SHARE ↗️, and FOLLOW for daily technical insights. The more you interact, the more I’ll keep bringing high-quality market breakdowns for you. 🚀
#ListedCompaniesAltcoinTreasury
Best of luck 🤞 🍀 🤞
---
