The $SOMI /USDT chart showcases an impressive rally, capturing the attention of traders with its strong bullish momentum. From a base level near 0.5140, the price surged to a high of 0.8546, marking a significant gain of over 47% in just 24 hours. This sharp move signals increasing interest and high buying pressure in the market.
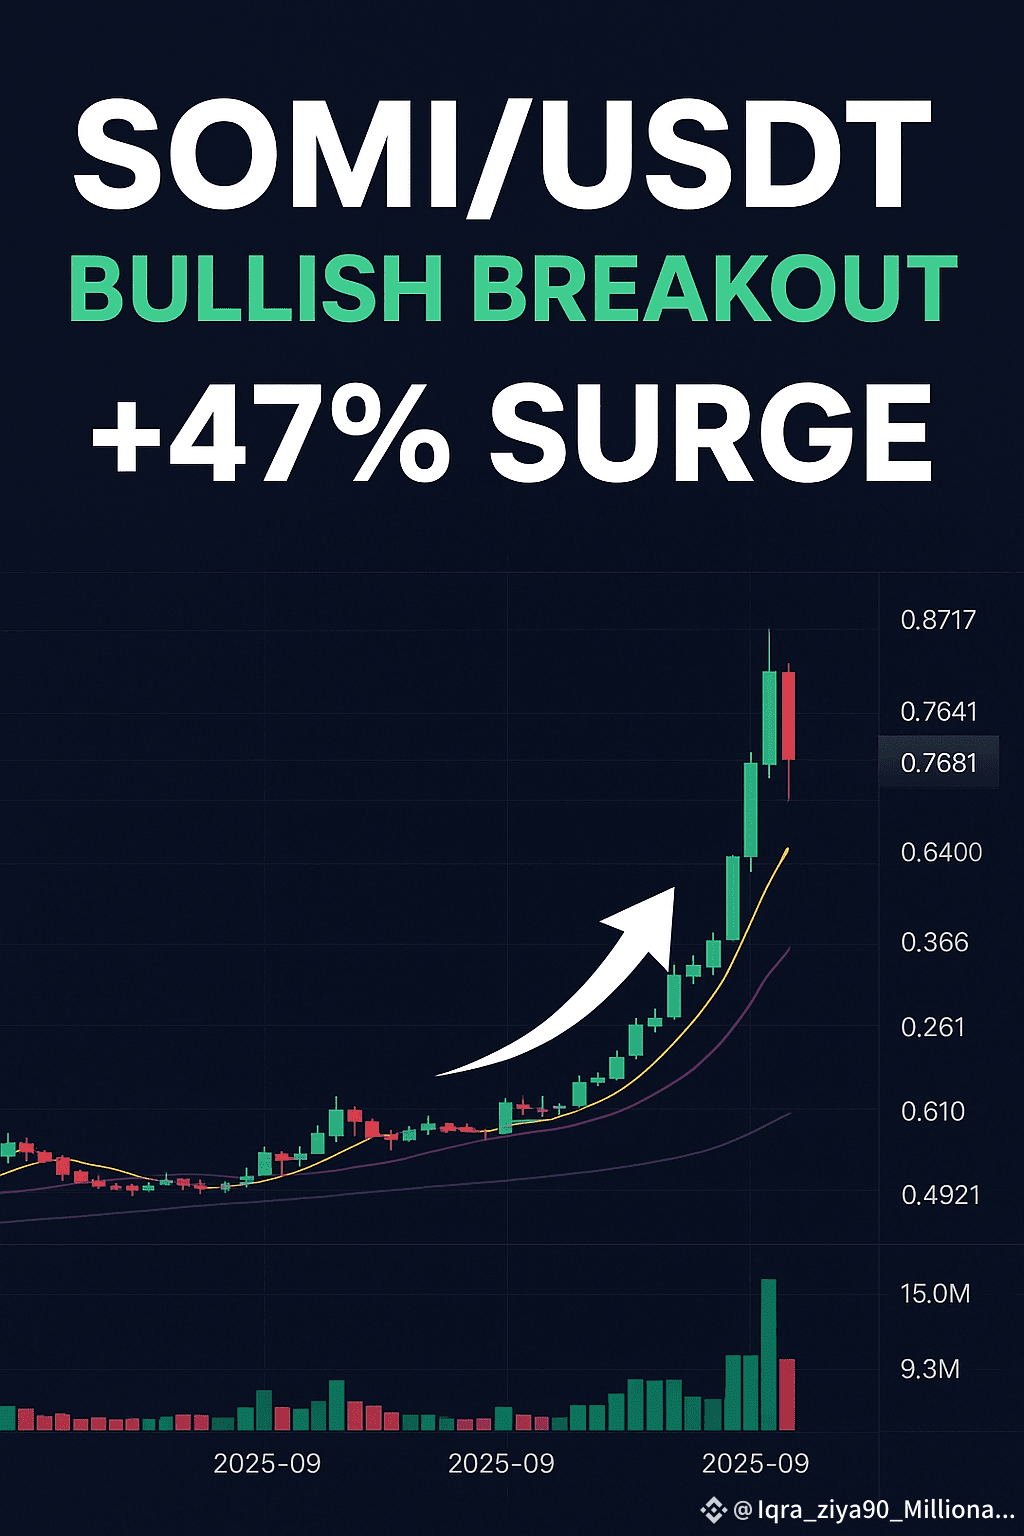
The breakout above resistance highlights strong confidence, but the small red candles near the top suggest mild profit-taking, which is natural after such a steep rally. Traders often view this type of retracement as a potential setup for the next bullish wave.
Overall, $SOMI is showing strength and market confidence. If it sustains above support zones,
it could maintain its bullish trend, making it a token to watch closely for potential short-term gains and long-term opportunities.
#MarketPullback #Binance #solana #altcoins #Megadrop

