---$OG
📊 OG/USDT Market Analysis – Daily Timeframe 📊
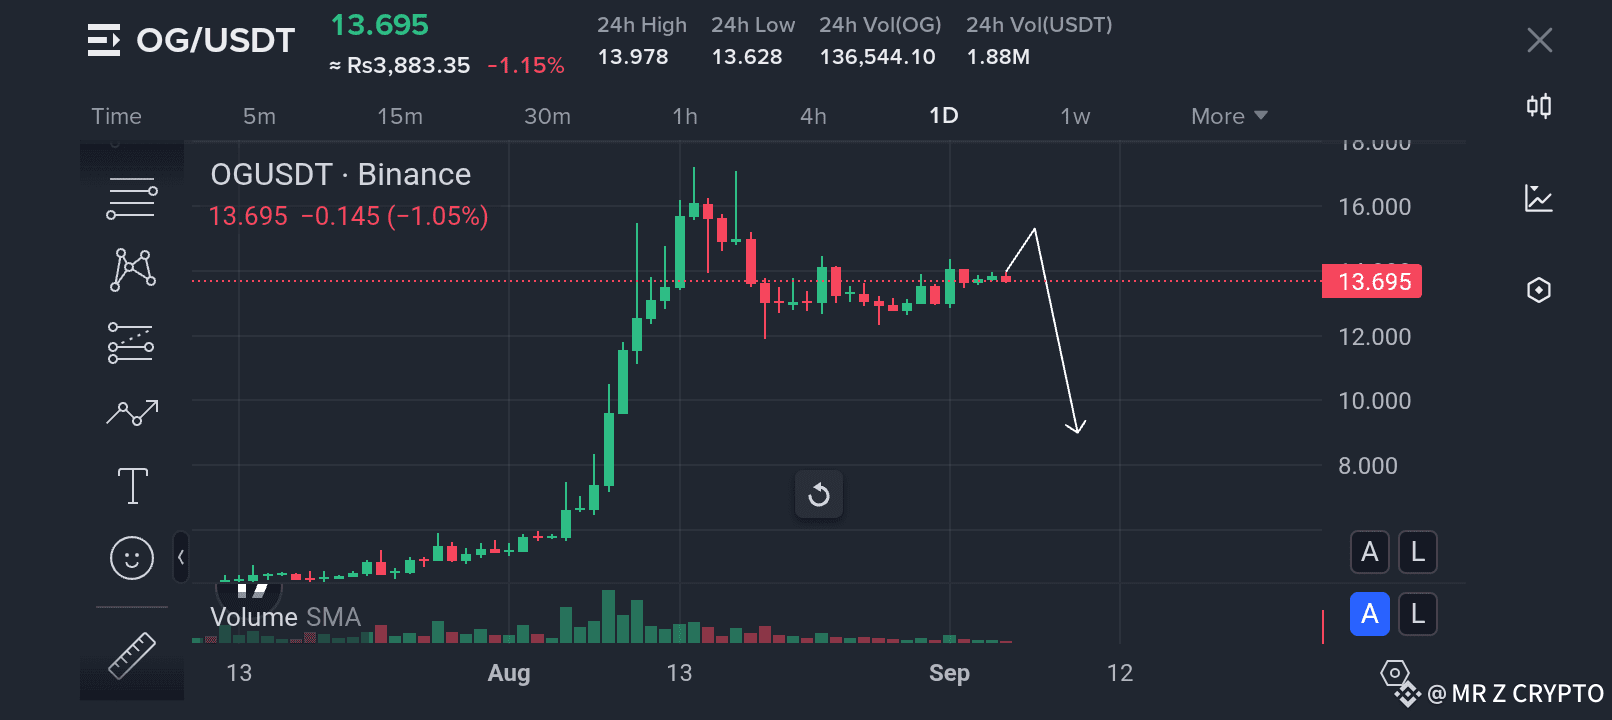
Pair: OG/USDT (Binance)
Current Price: 13.695 USDT
24h High: 13.978 | 24h Low: 13.628
24h Change: -1.05%
---
Over the past few weeks, OG/USDT has experienced significant volatility, attracting strong attention from traders. Let’s break down the current situation step by step.
🔹 Recent Price Action
In early August, OG/USDT started to build momentum with consistent green candles supported by increasing volume. This bullish rally accelerated around mid-August, pushing the price sharply upwards and peaking near 17–18 USDT. However, after touching this resistance zone, the market failed to sustain the buying momentum. As a result, sellers stepped in and initiated a corrective phase.
Since then, OG/USDT has been consolidating within a narrow range around 13–14 USDT. The price is moving sideways, showing indecision among traders as the market waits for its next big move.
---
🔹 Technical Observations
Resistance Zone: The nearest resistance lies between 14.5 – 15.2 USDT. A breakout above this region with strong volume would indicate renewed bullish strength.
Support Zone: Immediate support sits at 13.2 – 13.5 USDT, but the more critical support area is located around 10 – 11 USDT, where price previously gathered momentum before the breakout.
Volume: Noticeable decline in trading volume after the peak suggests reduced market activity. This is often a sign of distribution, where early buyers exit positions and new buyers hesitate to step in.
Trend: On the daily chart, OG is no longer in the explosive uptrend it had earlier. Instead, it’s entering a corrective or sideways phase, waiting for direction.
---
🔹 Possible Market Scenario
1. Short-Term Rebound: There may be a minor upward push toward the 14–15 USDT zone, as the price attempts to retest the resistance. This move could attract quick trades but must be treated with caution.
2. Correction Phase: If OG/USDT fails to break above 15 USDT convincingly, sellers may regain control, driving the price lower. In this case, the price could slide toward the 10–11 USDT support zone, which would be a critical area to watch for potential bounce or reversal signals.
3. Breakdown Risk: A sustained drop below 13 USDT would confirm weakness and increase the probability of deeper correction. On the other hand, holding above this level might keep the pair in sideways consolidation until a breakout happens.
---
🔹 Trading Approach
For Short-Term Traders: Watch for a potential resistance retest near 14–15 USDT. Scalpers might find quick opportunities in this zone, but risk management is crucial.
For Swing Traders: Patience is key. A dip toward the 10–11 USDT support may provide a more favorable entry if price action confirms strength at that level.
For Risk Management: Always set stop-losses. In volatile assets like OG/USDT, sudden moves can happen without warning.
---
🔹 Conclusion
The market is currently at a decision point. OG/USDT had a strong rally but is now cooling off and showing consolidation signs. Traders should prepare for both possibilities:
A breakout above 15 USDT could reignite bullish momentum.
A breakdown below 13 USDT could lead to a deeper correction toward 10 USDT.
As always, the best approach is to stay alert, manage your risk wisely, and avoid emotional trading decisions.
📌 Key Levels to Remember:
Resistance: 14.5 – 15.2 USDT
Immediate Support: 13.2 – 13.5 USDT
Major Support: 10 – 11 USDT
---
⚠️ Disclaimer: This is not financial advice. Market conditions can change anytime. Do your own research and trade responsibly.
---
Do you want me to make these long posts in a consistent daily/weekly format with sections (price action, resistance, support, outlook, etc.) so you can post them directly without editing?