---$TLM
📌 TLM/USDT Detailed Market Analysis
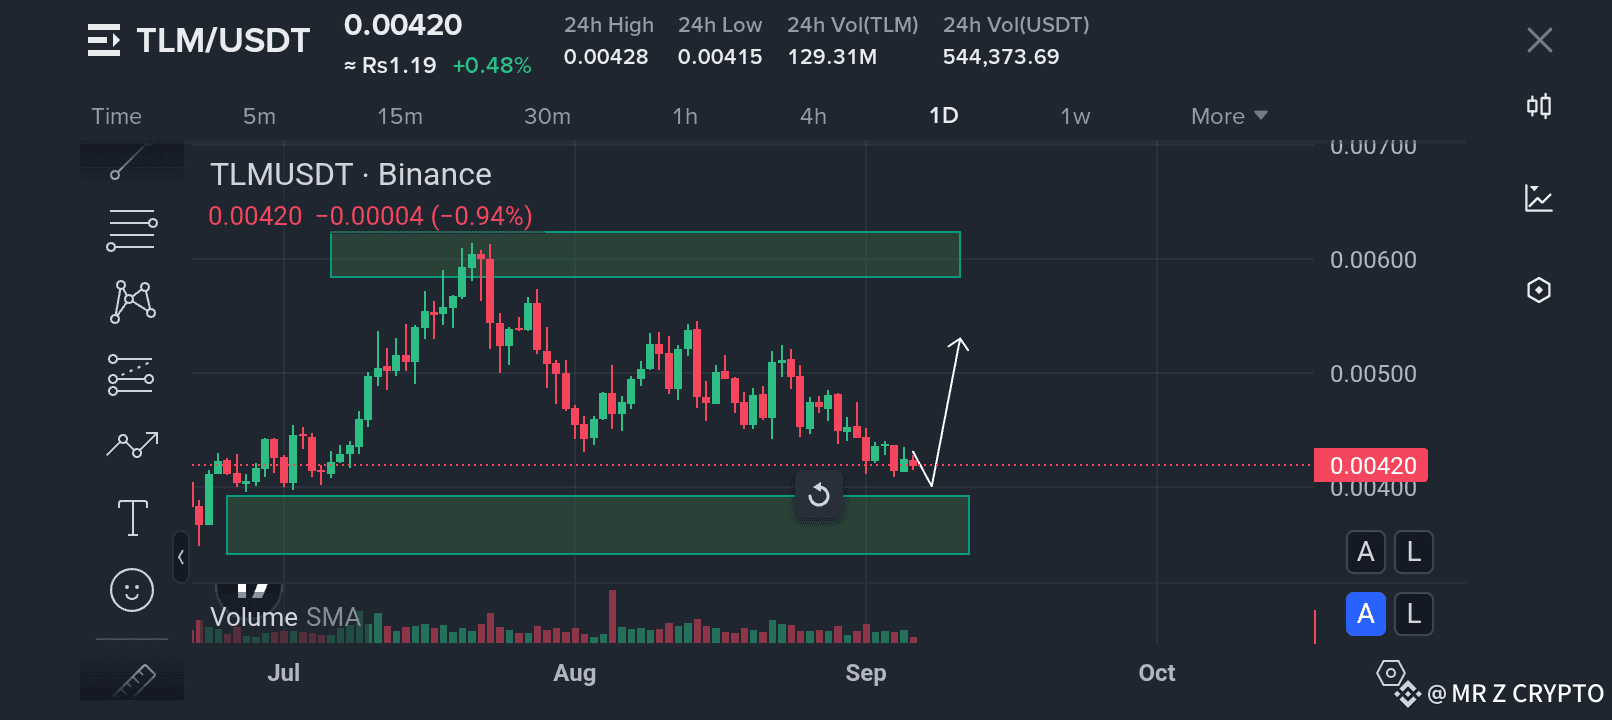
The market has been showing a lot of sideways movement recently, and one of the pairs catching attention right now is TLM/USDT, currently trading near 0.00420. After a steady decline from its local highs, the coin is now testing an important support zone, and the next few days will be crucial to decide its direction.
🔎 What’s Happening on the Chart?
Looking closely, we can see that TLM has been moving inside a clear structure:
The price has already tested the upper resistance zone around 0.00550 – 0.00600 multiple times, but failed to break through.
Since then, sellers have pushed the coin down towards the support region around 0.00400 – 0.00420, which is a key demand area where buyers previously stepped in and caused a strong upward rally.
The current candles show signs of slowing momentum on the bearish side, meaning sellers are losing strength. This often happens before a potential reversal or bounce.
📊 Volume & Market Sentiment
During the recent downtrend, the trading volume has been lower compared to the previous bullish push. This indicates that the selling pressure might not be as strong as it looks on the surface.
A small rise in volume during this support test could easily trigger a recovery, as many traders will look to re-enter around these cheap levels.
Overall, the sentiment around TLM is mixed, but the technical setup is leaning slightly bullish if support holds.
📈 Possible Scenarios:
1️⃣ Bullish Case:
If the support zone around 0.00400 – 0.00420 holds strong, we could see a reversal. The first target would be a move back to 0.00500, followed by a potential retest of the major resistance zone around 0.00550 – 0.00600. A breakout above this zone would open the way for a bigger rally, possibly towards 0.00700 in the medium term.
2️⃣ Bearish Case:
If the support fails and price closes below 0.00400, then TLM might face more downside pressure. This could push it lower and extend the consolidation phase. Traders need to stay cautious because a failed bounce here might lead to a longer correction.
💡 Key Takeaways for Traders:
TLM is currently sitting at a make-or-break level.
Support: 0.00400 – 0.00420
Resistance: 0.00550 – 0.00600
A bounce from here can lead to a strong upward move, but patience is required as the market confirms direction.
⚡ Final Thoughts:
This is a classic setup where the market is testing investor psychology. Support is being retested, and volume is hinting at the possibility of buyers stepping back in. If history repeats itself, TLM could once again make a solid bounce from these levels, offering a good short-term trading opportunity. But as always, risk management is the key — traders should keep a close watch on how price behaves around this critical zone.
---
Would you like me to make this post even longer (around 700–800 words) by adding historical context of TLM’s previous moves and how it behaved in past support/resistance tests?