⚡$ETH
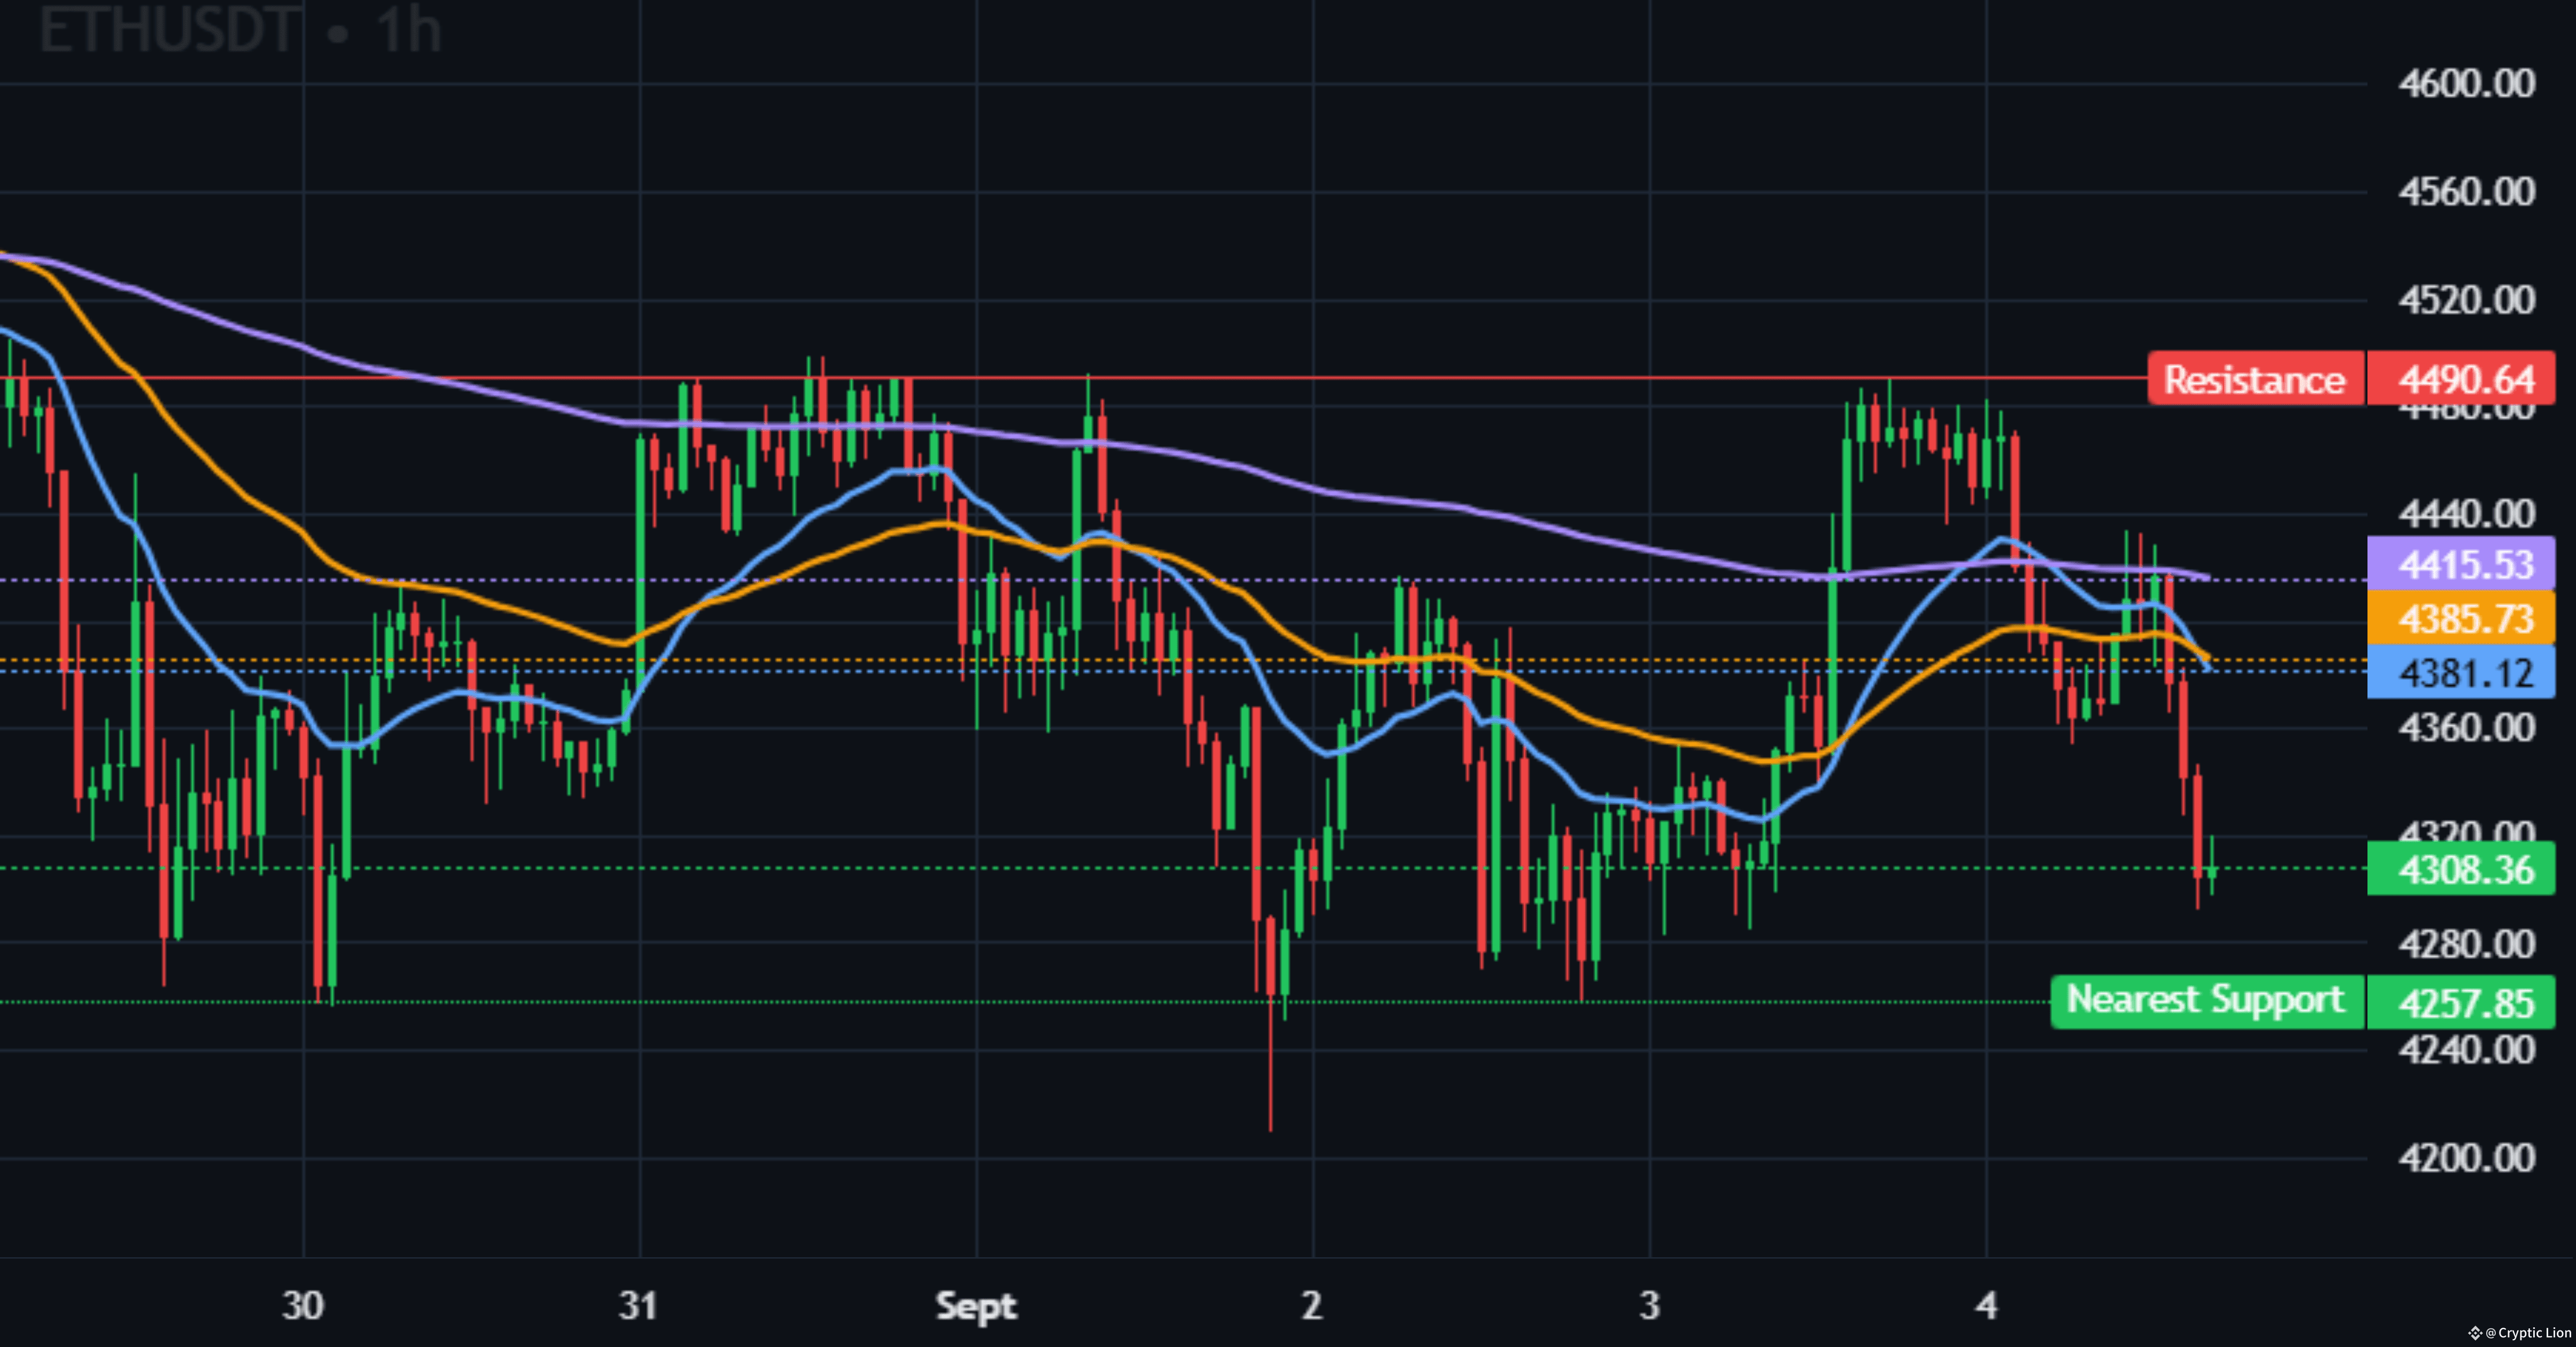
Ethereum (ETH/USDT) is once again standing at a crossroads, trading around $4,308 on the 1-hour chart. The market has been flashing red as sellers gain control, but oversold conditions and candlestick patterns suggest that a potential bounce could be brewing. Traders are closely watching the charts, waiting to see whether ETH will hold its ground or collapse toward $4,200.
📊 Trend & EMA Stack
The exponential moving averages (EMAs) are painting a bearish picture. On this timeframe, the EMA20 and EMA50 are both sitting below the 200 EMA, forming what traders call a bearish EMA stack. This setup reflects a market under pressure, where short-term momentum is fully in the hands of sellers. For bulls to flip sentiment, ETH needs to reclaim the faster EMAs quickly. Until then, the path of least resistance remains downward.
🔎 Indicators & Market Signals
Momentum indicators are also confirming the bearish bias. The MACD is showing a deep negative reading of -17.40, which reflects heavy selling momentum. While the Volume Oscillator is just slightly positive at 0.18, the reading is too weak to support any meaningful bullish breakout. Meanwhile, the RSI sits at 32.9, inching close to the oversold zone. This leaves the door open for a relief rally, but until buyers step in with volume, ETH remains vulnerable.
🏦 Order Book & Market Sentiment
The order book data tilts strongly in favor of the bears. With an order book imbalance of -9.8%, sell walls are dominating the market. Buyers are struggling to absorb the pressure, and the imbalance shows that demand is being outpaced. Funding rates are slightly negative at -0.003%, which reveals weak conviction from derivatives traders. This mix highlights a fragile market environment, where any additional selling pressure could trigger a quick flush lower.
🕯 Candlestick Patterns
The candlestick picture tells a more complicated story. A Tweezer Bottom suggests that buyers defended equal lows, showing some resilience. At the same time, a Spinning Top candlestick reflects indecision in the market, where neither buyers nor sellers hold full control. A Morning Star formation is also emerging, which is normally a bullish reversal sign, but weak volume makes this setup far less reliable. Together, these patterns show ETH trying to carve out a bottom, but conviction from bulls is still missing.
🎯 Trade Setup for Spot Traders
For spot traders, the critical levels are crystal clear. Resistance sits firmly at $4,490 to $4,500, a zone ETH has failed to break multiple times. Support lies at $4,257 down to $4,200, which has acted as a safety net during recent dips. If Ethereum can push above $4,400 with strong volume, a retest of the $4,490 zone becomes highly likely. On the other hand, if ETH loses $4,257 support, a rapid decline toward $4,200 or even lower could play out. In this setup, patience is key. Spot traders should consider accumulating cautiously near support and be prepared to take profits at resistance.
🏁 Verdict: High Risk, High Reward Zone 🌪
Ethereum is caught in a tug-of-war between bearish momentum and potential relief rally signals. The bearish EMA stack and sell wall dominance clearly give the edge to sellers, but the RSI nearing oversold and the presence of reversal candlesticks suggest that bulls may still have one more fight left in them. For now, ETH is trading in a high-risk, high-reward zone, where waiting for confirmation may be the smartest move.
⚠️ Disclaimer: This analysis is meant for spot trading only. Avoid leverage in this volatile setup, as ETH/USDT could swing sharply in either direction within hours. Always practice strict risk management, use stop-losses, and never trade with money you cannot afford to lose.
👉👉 Trade and Buy Here $ETH