⚡$ENA
ENA has just flashed a fresh buy signal on the daily chart, with the MACD histogram beginning to rise after a bearish cycle. This shift suggests that bearish momentum is fading, and a new wave of bullish momentum may be taking over. Let’s break down the setup step by step.
📊 Price Action & Trend
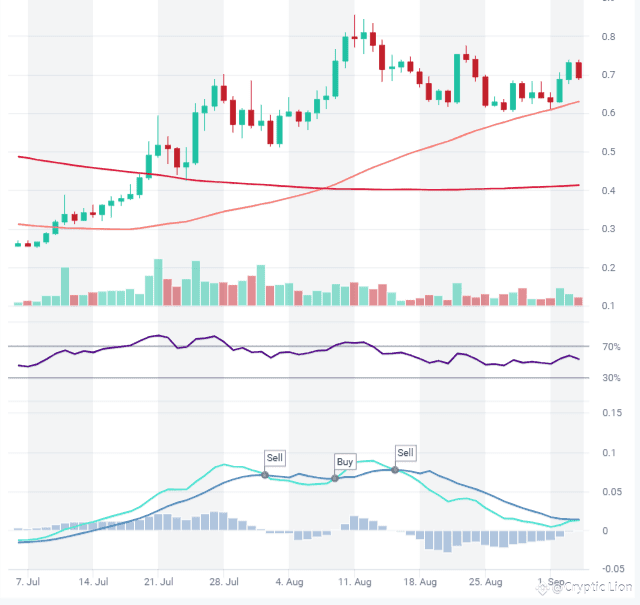
Over the past weeks, ENA has been consolidating after its strong July–August rally. The price has now stabilized above the 50-day SMA, which is acting as dynamic support. This signals that buyers are still in control of the medium-term trend, while the 200-day SMA further below confirms a strong long-term base.
At the moment, ENA is trading just under $0.72, which is a critical zone. A daily candle close above this level could trigger a continuation toward the next resistance levels.
🔎 Momentum Indicators
The MACD histogram has started to rise, showing early signs of bullish momentum building again. This is supported by the RSI, which sits in the neutral zone (around 45–50), leaving plenty of room for an upside move without being overbought.
Volume has also shown small upticks during green candles, suggesting that buyers are beginning to step back in after the recent consolidation.
🏦 Support & Resistance Levels
Nearest Support: $0.63 (aligned with the 50-day SMA and recent swing lows).
Nearest Resistance: $0.75 (immediate ceiling from the last rejection).
Extended Resistance: $0.85 (major zone from the August rally).
These levels form the key decision zones for traders — holding support keeps the bullish case alive, while breaking resistance confirms continuation.
🎯 Trade Setup (Signal Alert Style)
Entry Zone:$0.70 – $0.72 (after a daily close above $0.70 with strong volume).
Take Profit (TP1): $0.78 (recent swing high).
Take Profit 2 (TP2): $0.85 (major resistance).
*Stop Loss (SL): $0.63 (below SMA50 and nearest support).
This setup gives a clear risk-reward structure: protecting capital at $0.63 while targeting upside moves toward $0.78 and $0.85.
🏁 Verdict: Buy Signal Active ⚡
With the MACD histogram flipping bullish, ENA has officially entered buy mode on the daily chart. If the price can confirm a close above $0.70 with rising volume, it opens the door for a move toward $0.78 and $0.85. A retest of \$0.70 holding as new support would strengthen the bullish case further.
👉 For traders, this is a high-probability breakout setup — but risk management is key. Keeping a tight stop at $0.63 ensures protection in case the signal fails and momentum reverses.
👉👉Trade here $ENA #RedSeptember