---$WLFI
📊 WLFI/USDT 15M Technical Outlook – Trader’s Eye Analysis 📊
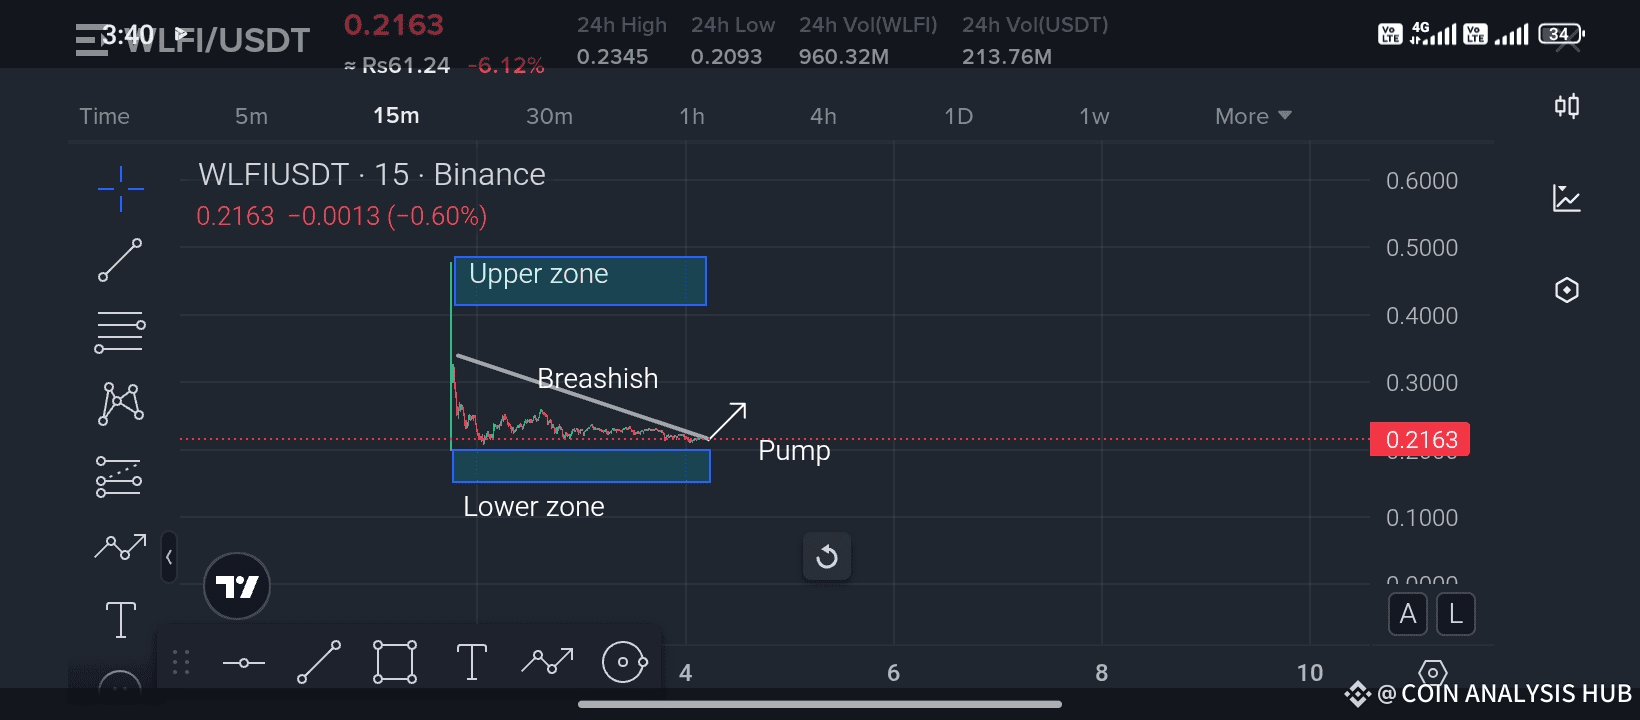
Currently, WLF/USDT is trading around 0.2163, showing a -0.60% decline in the short-term frame. The chart is forming an interesting pattern where price has been consolidating between the Upper Zone (0.30 – 0.60 range) and the Lower Zone (0.20 – 0.21 range).
🔎 Key Observations:
The market has been moving in a bearish wedge structure, pressing downward gradually.
We can notice strong support forming at the lower zone, which has been respected multiple times.
A potential pump setup is visible if the price manages to hold this support and break out of the wedge.
If momentum builds up, we could see a breakout attempt towards the upper resistance zones, which may trigger a short-term bullish rally.
⚖️ Trader’s Takeaway:
If WLF holds above the 0.21 level, it could signal strength for a potential upward move.
Breaking below the lower zone, however, might open doors for further downside.
Smart traders wait for confirmation – a clear breakout above resistance before entering for the pump.
📌 Pro Tip: Always manage risk wisely – support levels are for testing, but without volume confirmation, false breakouts can trap traders.
🚀 If you find my analysis useful, don’t forget to LIKE 👍, SHARE 🔄, and FOLLOW ✅ my channel. Your support motivates me to bring more sharp and eye-catching technical breakdowns that help you stay ahead in the market!
##ListedCompaniesAltcoinTreasury
Best of luck 🤞 🍀 🤞
