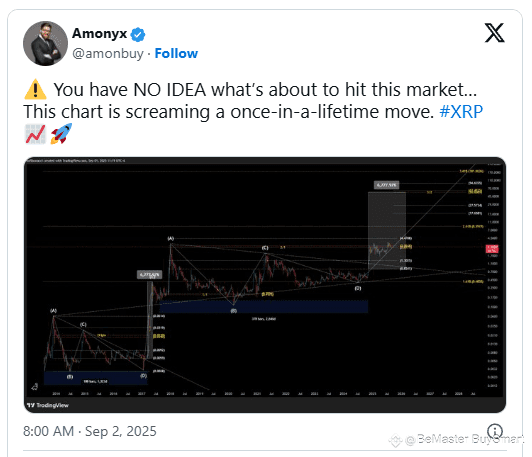
$XRP Amonyx (@amonbuy), a crypto analyst on X, recently shared his outlook on XRP with a chart highlighting its potential trajectory. His post emphasized the possibility of significant future gains, using technical indicators to outline possible price levels.
The chart he published drew from Fibonacci levels, long-term cycles, and structural formations that have historically guided XRP’s movements.
Amonyx noted that XRP may be positioned for an extended bullish cycle, with long-term projections suggesting a once-in-a-lifetime opportunity. His analysis highlighted how the token has historically followed repetitive structures, with each cycle providing clues for future direction.
✨Chart Structure and Key Levels
The chart shared by Amonyx covers XRP’s price history stretching back to 2013. It identifies long-term patterns through an Elliott Wave and Fibonacci-based framework.
The labeling shows cycles marked by points A, B, C, and D, outlining corrective phases followed by expansions. The most recent cycle appears to set the stage for another major rally, with Fibonacci projections indicating the possibility of a steep move upward.
XRP formed Wave A after its previous all-time high of $3.36 in January 2018. Following this move, it experienced a share correction, reaching the low point of Wave B in 2020. It reached the peak of Wave C in 2021. However, it could not break out significantly due to price suppression caused by the Ripple lawsuit.
The asset hit Wave D bottom in April after reaching its lowest point of 2025. Following this decline, XRP entered Wave E, the final wave, and began ascending. Wave E has already pushed the asset to a new all-time high of $3.65, and Amonyx’s chart suggests that this climb is not over.
✨Where’s XRP Going Next?
One notable figure on the chart is the projected gain of more than 6,700%. This estimate is anchored in past moves where XRP surged thousands of percentage points in a relatively short period. The closest target for XRP currently sits at $4.47, and this level could serve as support as it targets higher levels.
Subsequent targets are $8.59 (Fib. 2.618), $17.65, $27.57, $56.66, $62.48, $94.63, and $181.86 (Fib. 3.618). With XRP’s price struggling at around $2.83, these targets suggest that a major rebound might be on the horizon, and the asset’s long-term trajectory is bullish.
🚀🚀🚀 FOLLOW BE_MASTER BUY_SMART 💰💰💰
Appreciate the work. 😍 Thank You. 👍 FOLLOW BeMaster BuySmart 🚀 TO FIND OUT MORE $$$$$ 🤩 BE MASTER BUY SMART 💰🤩
🚀🚀🚀 PLEASE CLICK FOLLOW BE MASTER BUY SMART - Thank You.

